A Second Open Letter to AI Employees

To: The AI employee at the center of a defining wealth-creation moment

From: An independent wealth manager

Re: How much of your stock should you keep?

The essence of investment management is the management of risks, not the management of returns.” – Benjamin Graham (Warren Buffett’s mentor)

A few months ago, we published An Open Letter to AI Employees that focused on whom to trust when navigating the financial decisions that come with sudden wealth. Its central message was simple: The plan should come before the products. In this letter, we turn to a question we raised then, but that deserves a deeper review: How should you think about wealth concentrated in a single company?

Even high expected returns do not necessarily translate into greater lasting wealth when that wealth is also funding your life. If those returns come with sufficiently high volatility, withdrawals during drawdowns can leave a concentrated portfolio with less terminal wealth than a lower-returning, more diversified portfolio.

Your Belief in the Company Is Not in Question

When you joined your company, the risk was clear. You committed a meaningful part of your career to a business with an uncertain future, and your equity compensation reflected the risk you were taking. The outcome may now have moved substantially in your favor, creating wealth capable of supporting or even exceeding your loftiest financial goals.

That success creates a different set of considerations. The position that generated the wealth may now be the largest source of risk on your balance sheet. Your central concern is no longer simply whether the company can continue to succeed. You must now also weigh how much of your financial future should continue to depend on that single company’s prosperity. One useful starting point is to ask: If this same exposure were sitting in cash today, how much would you choose to put back into this one stock?

A thoughtful plan can preserve meaningful participation in the company’s future while establishing a diversified foundation that is not dependent on a single outcome. Stock-specific risk can produce outsized returns, as you have already experienced. It can also create a much wider range of potential outcomes than you’re likely to experience with a diversified portfolio. That difference points to an important distinction between creating wealth and preserving it: Concentration can make you rich; diversification can help keep you rich.

Over the Last 100 Years, Most Stocks Did Not Outperform
Lifetime excess return of 29,754 U.S. common stocks vs. the S&P500, 1926–2025. Source: Bessembinder (2026).

Start with the historical record of single-stock performance. A handful of companies can generate extraordinary returns, but the distribution of outcomes has always been remarkably uneven.

According to research from Hendrik Bessembinder at Arizona State University, across the 29,754 U.S. common stocks that were publicly listed between 1926 and 2025, only about 28% outperformed the S&P 500 over their listed lifetimes. The median stock trailed the index by approximately 102percentage points cumulatively. Just 46 companies accounted for half of the $91 trillion the U.S. stock market created over the last century, while fewer than 4% of listed companies produced all that net wealth.¹

You hear about the winners because they often make compelling stories. The much larger number of companies that underperform or ultimately disappear receive far less attention.
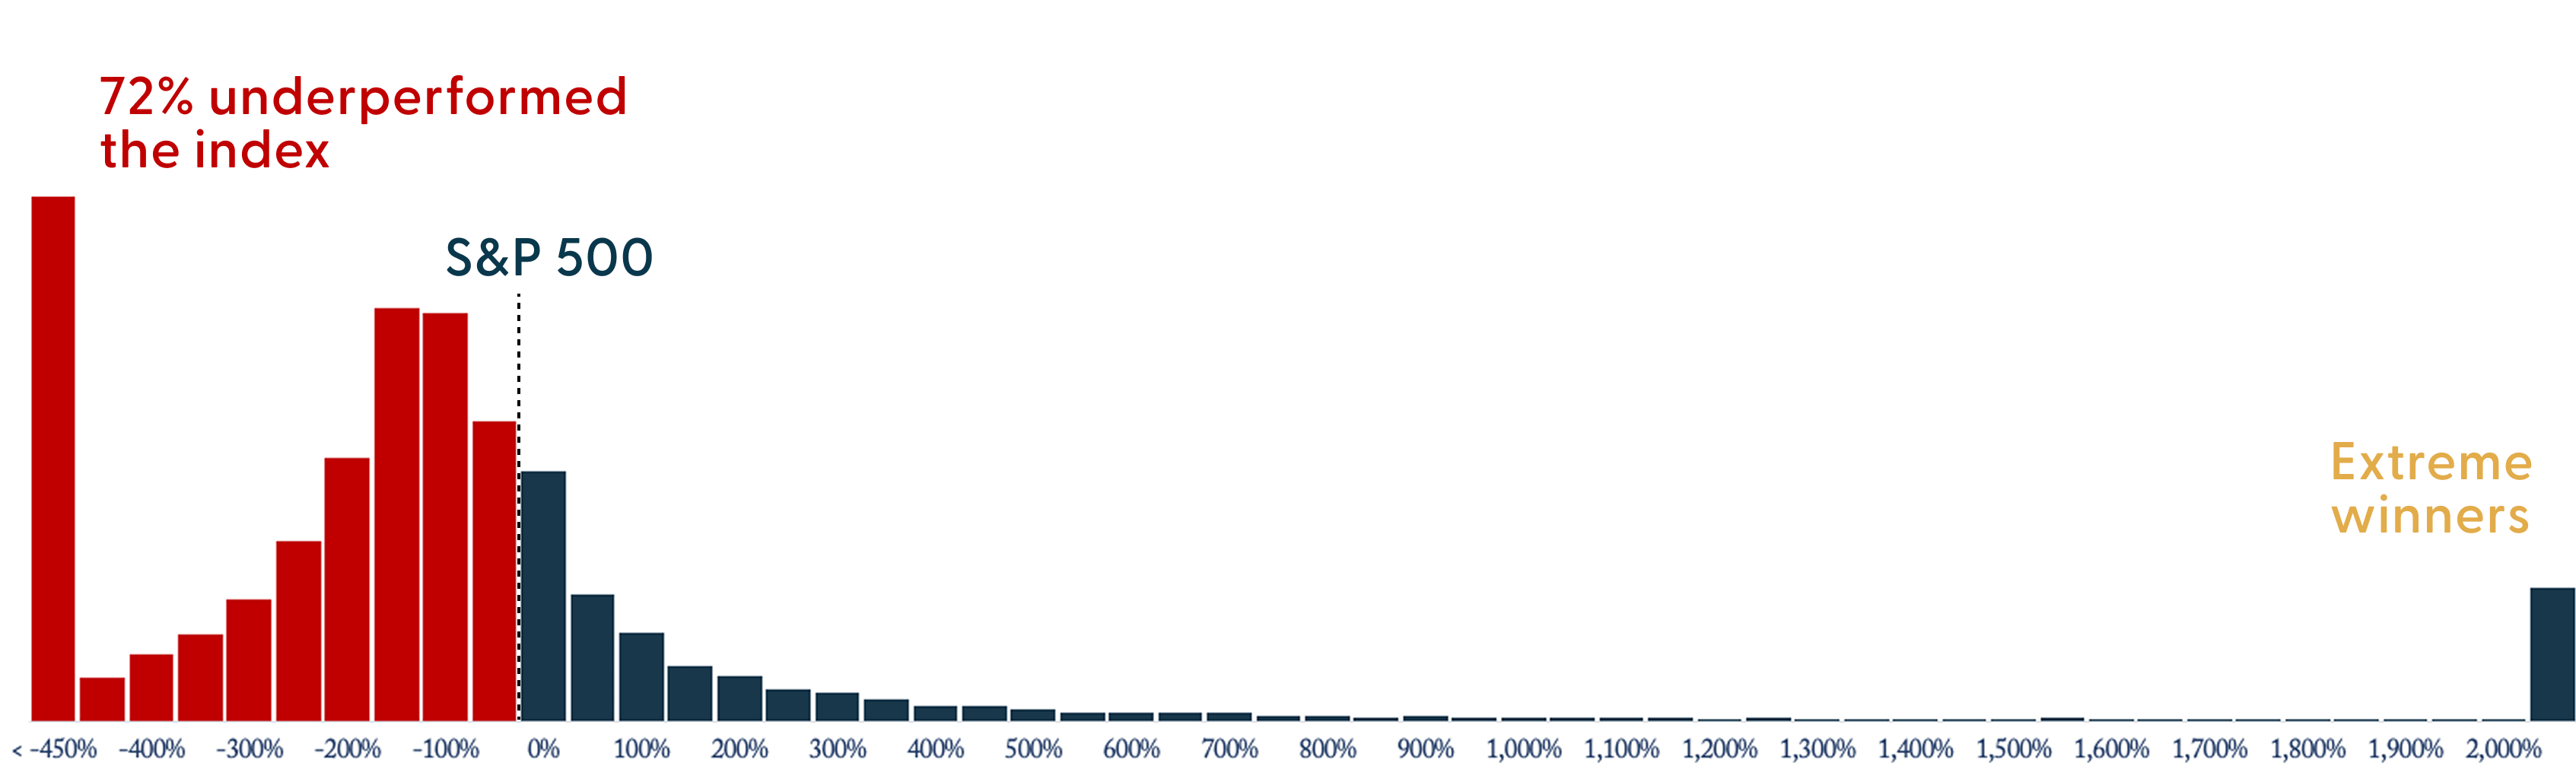
Lifetime return of each U.S.-listed stock, relative to the S&P 500 (1926-2025)
Lifetime excess return of 29,754 U.S. common stocks vs. the S&P 500, 1926–2025. Source: Bessembinder (2026).

Of course, we can’t anticipate your company’s future performance, and this historical review doesn’t suggest that your company is average. It may ultimately prove to be one of the small number of businesses responsible for a disproportionate share of long-term wealth creation. But even transformational companies experience major drawdowns. Protecting your financial well-being means recognizing that reality and planning accordingly.

Even the Best-Performing Stocks Had Long Periods of Poor Performance

Apple, NVIDIA, Microsoft, Alphabet, and Amazon together accounted for more than 21% of all net shareholder wealth created in U.S. public markets over the last 100 years. These companies delivered extraordinary long-term wealth creation, but capturing all the gains required enduring severe declines and lengthy recoveries.²

These five extraordinary companies experienced 73 separate declines of at least 20%, including 20 that cut the stock’s value by more than half. Extended drawdowns were not unusual. Apple and NVIDIA spent more than half of their trading histories at least 20% below a prior peak, compared with just 13% for theS&P 500.
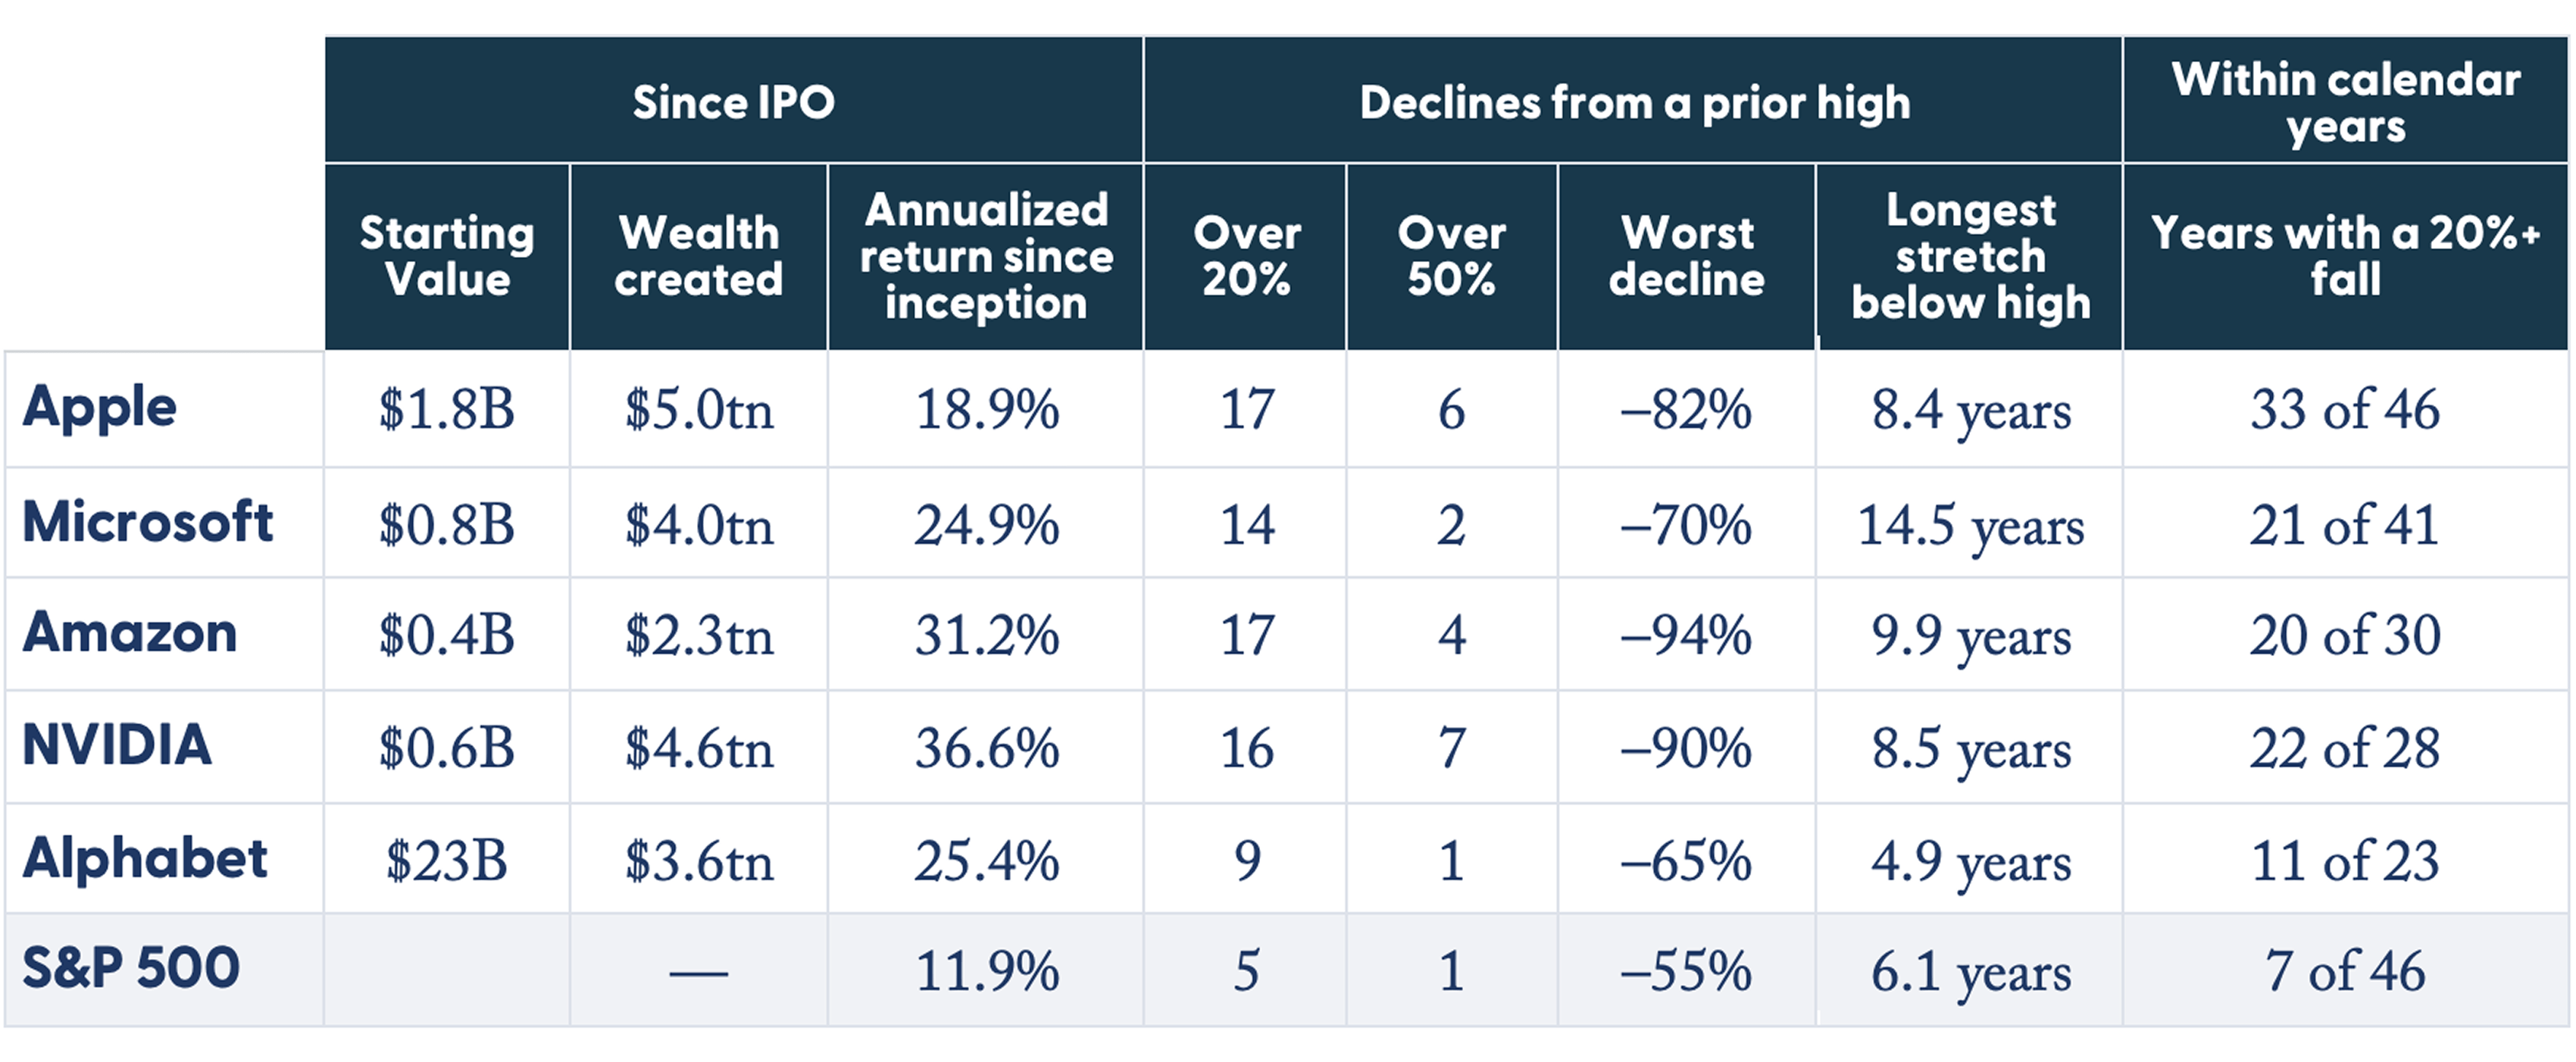
Apple, NVIDIA, Microsoft, Alphabet, and Amazon together accounted for more than 21% of all net shareholder wealth created in U.S. public markets over the last 100 years.
Source: FactSet (return data); Baker Street Advisors (calculations). Returns are measured from IPO date through July 31st, 2026: Apple December 1980, Microsoft March 1986, Amazon May 1997, NVIDIA January 1999, Alphabet August 2004, S&P 500 January 1981. Company returns are daily throughout. The S&P 500 series is month-end for 1981–1987 and daily from January 1988 onwards. Values at IPO are based on market capitalization at the end of the first public trading day for each company. 

Notably, Amazon declined 94% and took more than nine years to regain its prior high. A $20 million position would have fallen to $1.2 million, requiring a subsequent 1,570% gain to recover its original value. Microsoft peaked in January 2000 and did not return to that level until July 2014, despite being dominant and financially successful throughout much of that period.
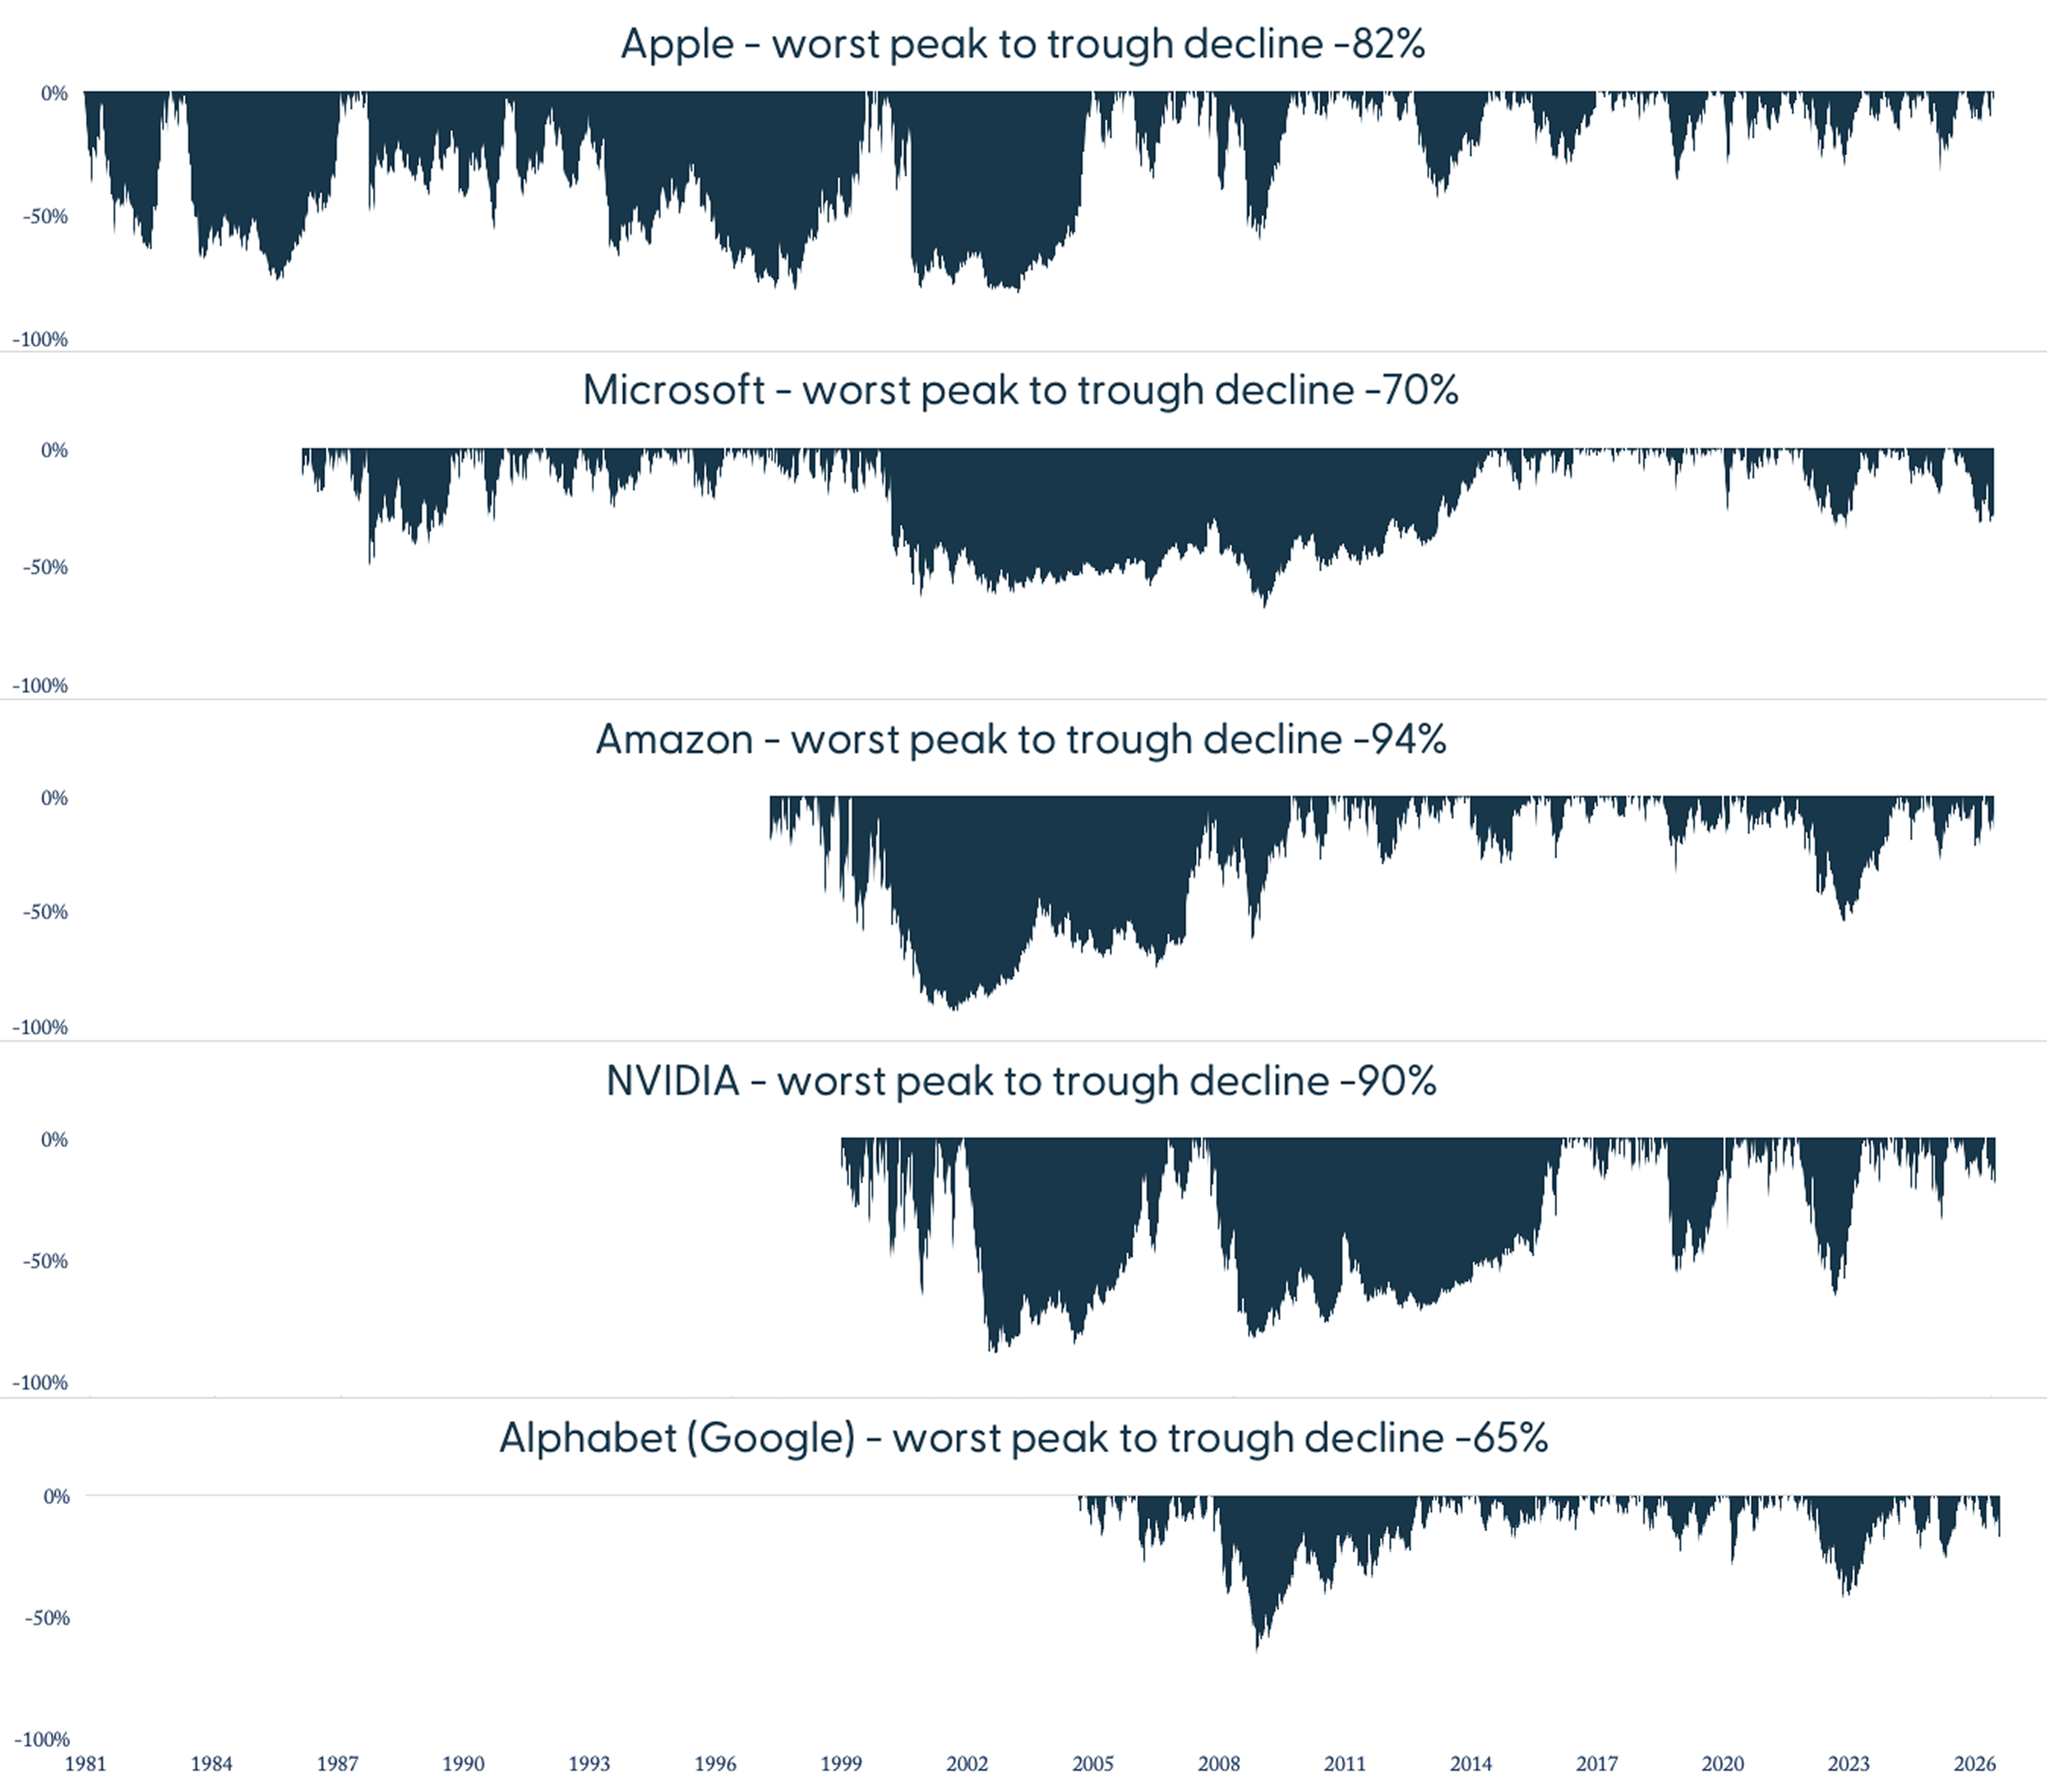
Even the Best-Performing Stocks Had Long Periods of Poor Performance
Percentage below prior peak, month-end, from each company’s first full month of trading through June 2026. Source: Baker Street Advisors’ analysis of monthly total returns. The companies discussed herein are provided for illustrative purposes only and do not imply affiliation with or endorsement by such firms or businesses.

These companies were among the greatest wealth-creating enterprises in U.S. market history. Owning them successfully still meant enduring losses and recovery periods that would have been extraordinarily difficult in real time.

For an investor who is committed to staying in the market over the long term and has sufficient liquidity, even severe drawdowns may be manageable. But risk tolerance is only part of the equation. You might need that capital for spending or meeting other financial goals, but selling during a major drawdown can turn a temporary decline into a permanent loss. Given these factors, the amount of concentrated stock you can afford to hold may be very different from the amount you are willing to hold.

Knowing the Risk Is Different from Living Through It

Morgan Housel’s The Psychology of Money emphasizes that investment outcomes depend as much on behavior as analysis. Most shareholders understand that a concentrated position is risky. How they will respond when that risk becomes real is more difficult to predict.

A 50% decline looks the same on a statement whether it proves to be a temporary setback or a permanent impairment. In real time, there is no way to know with certainty which one it will be. And the challenge is not merely psychological. If too much of the wealth you need for spending, taxes, or other goals remains tied to the stock, a severe decline can create pressure to sell into the decline— potentially converting a temporary drawdown into a permanent loss.

Concentration may have created your fortune, but preserving wealth requires a margin for error.

$20 Million, Drawing $800,000 a Year (4%), Over 30 Years

Once you spend from the portfolio, every decline is funded by selling shares that are never there to recover.
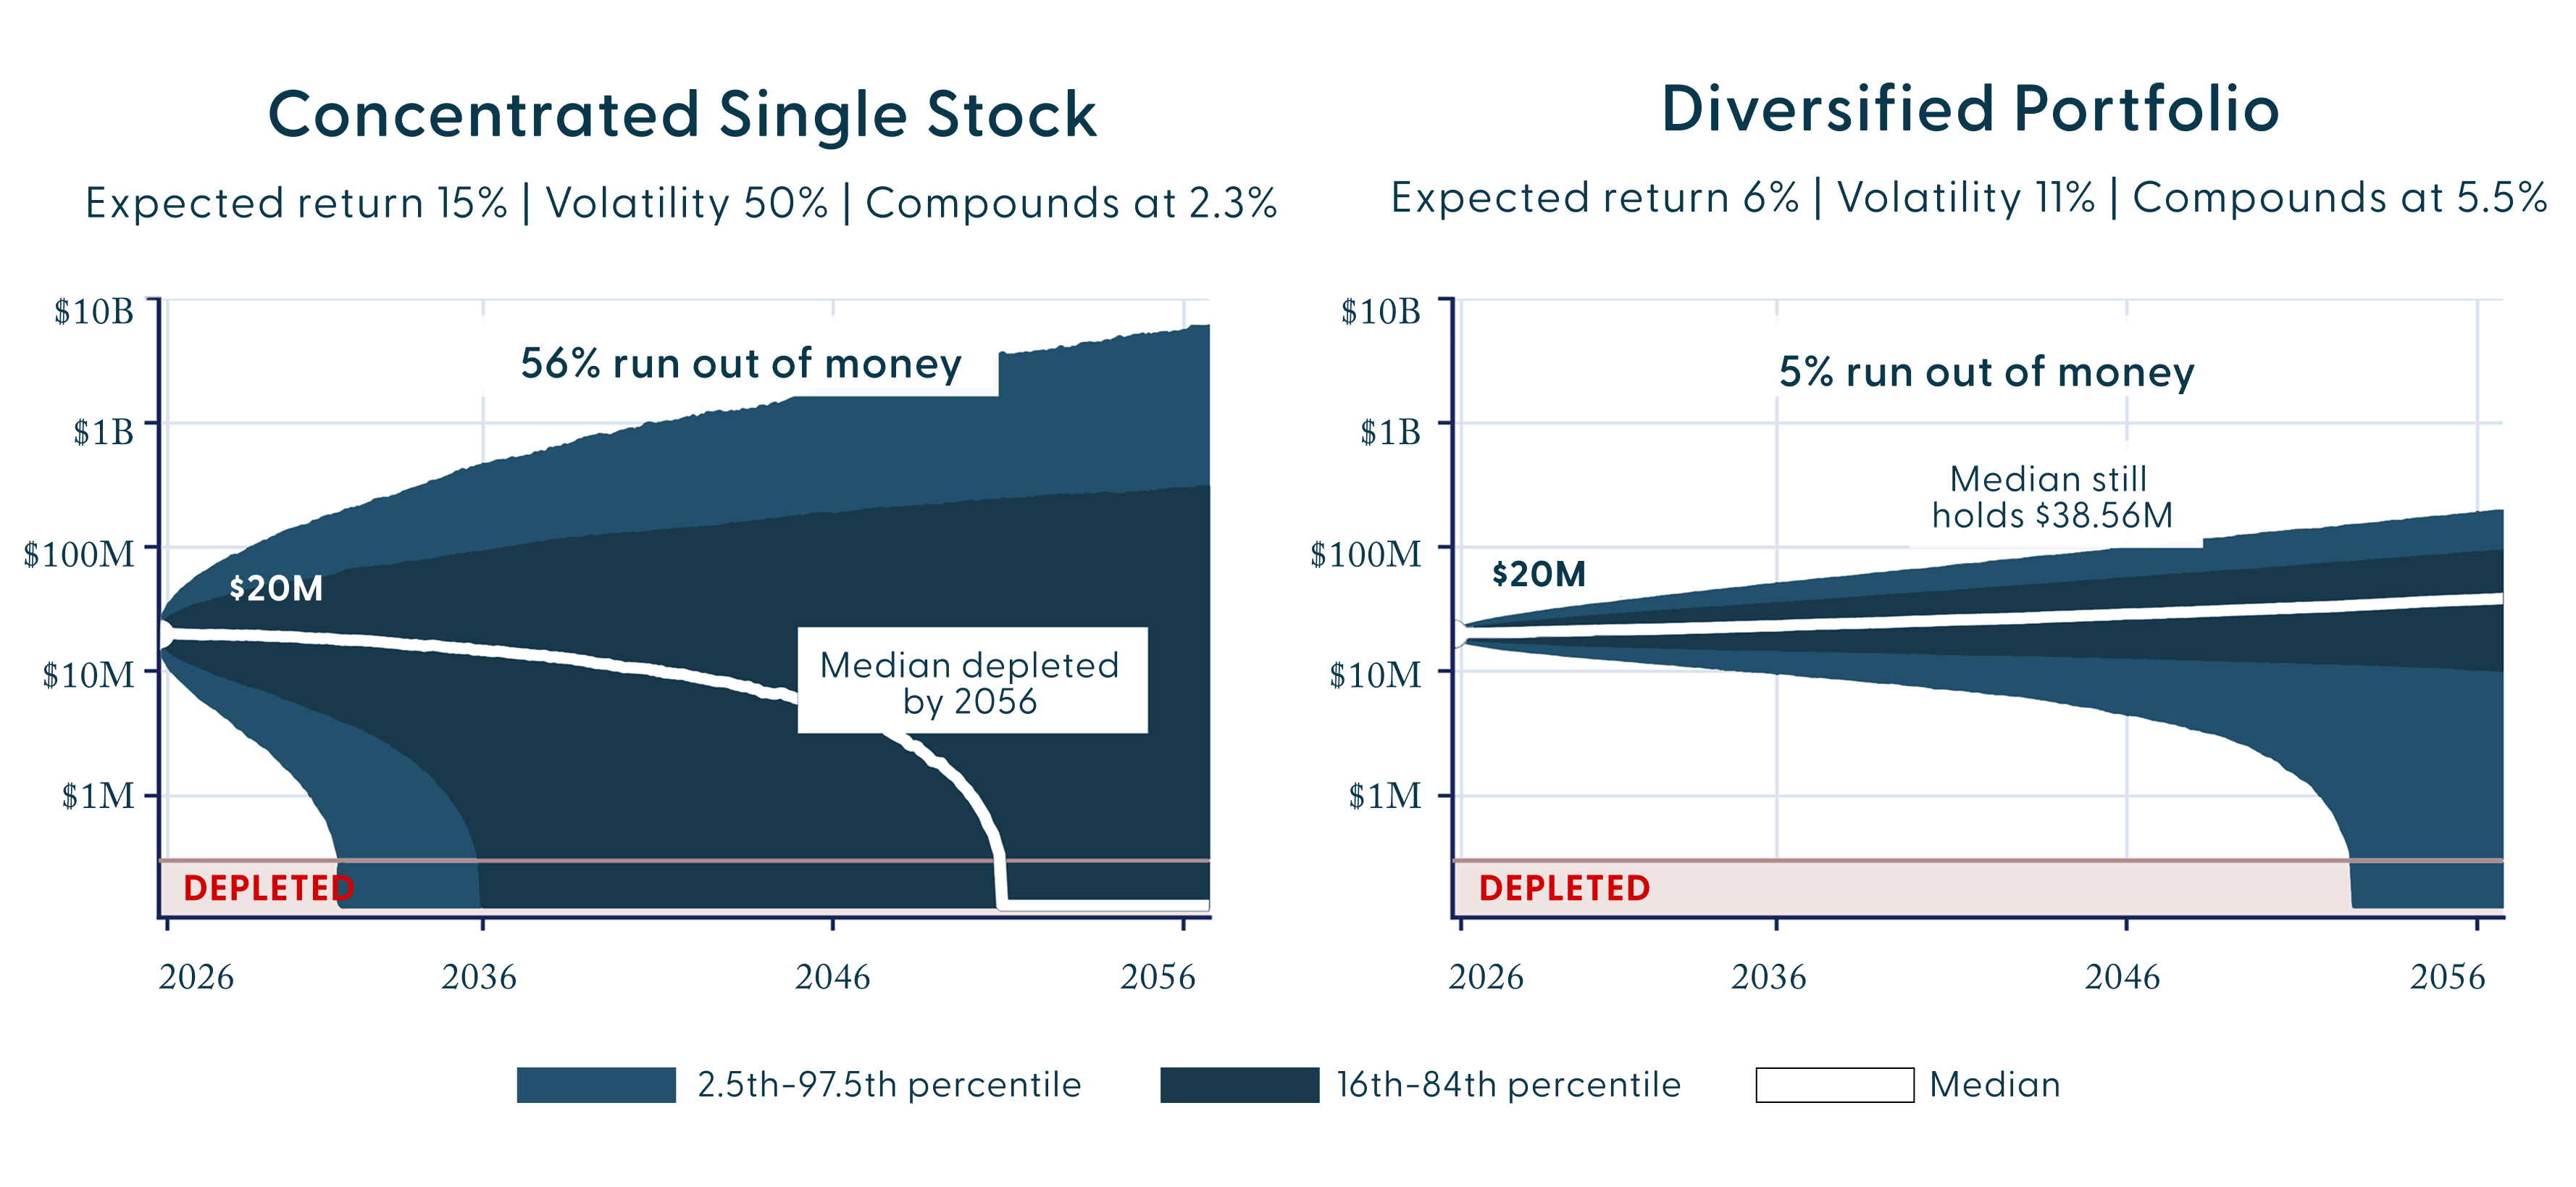
$20 Million, Drawing $800,000 a Year (4%), Over 30 Years
Illustrative only; not a projection. 10,000 Monte Carlo simulations of monthly returns; unlevered, pre-tax, pre-fee, nominal. Withdrawals of $66,667 monthly, not adjusted for inflation; values floored at zero. Log scale. At a 15% expected return, the two portfolios reach equal median outcomes at roughly 44%volatility — above that, the higher expected return is worth less. Source: Baker Street Advisors’ analysis.  This does not represent actual performance, was not achieved by any investor, and actual results may vary substantially.

Turning the Decision into a Plan

“Selling when it feels right” is not a strategy. Eliminating concentration completely is not the goal. The point is to size that concentration so that no single outcome can derail the life your wealth is intended to support.

A disciplined plan should incorporate four steps:

1
Secure the Foundation
Determine what your spending, taxes, and major goals require regardless of what the stock does. Secure that first, so those commitments no longer depend on one company.
2
Diversify Around the Position
Your salary, unvested equity, vested stock, and your career prospects all track the same sector. The rest of the portfolio is the only place you can offset that, so build it deliberately against what you already own.
3
Set the Rules
Set target concentration and portfolio risk ranges in advance. Rebalance when those limits are breached, rather than relying on prediction or emotion.
4
Sequence the Exit
Diversification is a schedule, not a decision. Fix sizing, tax treatment and timing in advance so execution is mechanical rather than under pressure.

The objective is not to maximize the chance of ending with the highest possible net worth. It is to increase the probability that the wealth you have already created can support your goals across a wide range of outcomes, while preserving meaningful participation in your company's future. How much stock you should keep follows from that objective.

Sincerely,
Baker Street Advisors

Sources
1 Hendrik Bessembinder, “One Hundred Years in the U.S. Stock Markets,” March 21, 2026. Using Center for Research in Security Prices (CRSP) data on 29,754 U.S. common stocks, 1926–2025. Excess return measured over each stock’s listed life versus the S&P 500, a broad index of U.S. stocks.
² Wealth-creation figures through December 2025: Apple $5.02 tn (5.52% of all net wealth created), NVIDIA $4.58 tn (5.03%), Microsoft $4.03 tn (4.43%), Alphabet $3.57 tn (3.93%), Amazon $2.27 tn (2.49%), or 21.39% cumulatively. Source: Bessembinder (2026). Baker Street Advisors calculated drawdown statistics from monthly total returns, measured from each company’s first full month of trading through June 2026. We counted a decline once the price reached 20% below a prior month-end high and treated the drawdown as continuing until the stock recovered that high. Month-end measurement understates intra-month extremes; on daily data, each of the worst declines shown was 2 to 6 percentage points deeper.
Disclaimer
Baker Street Advisors, LLC (“Baker Street”) is an investment adviser registered with the U.S. Securities and Exchange Commission. Registration as an investment adviser does not imply any particular level of skill or training. This material is provided for informational and educational purposes only and reflects the views of Baker Street as of the date published, which are subject to change without notice.
Investing, estate planning, or other professional advice. It is not a recommendation or solicitation to buy, sell, hold, or otherwise transact in any security, investment product, strategy, structure, or financial instrument, nor is it an offer to provide advisory services. Readers should not rely on this material as the basis for any financial, investment, tax, legal, or estate planning decision. References to specific companies are for illustrative and educational purposes only and are not recommendations to buy, sell, or hold any security.
The planning concepts discussed, including concentrated stock, equity compensation, liquidity events, tender offers, secondary sales, tax-awareinvestment strategies, charitable planning, estate planning, diversification, borrowing, direct indexing, exchange funds, collars, long/short tax-lossharvesting, private investments, and other complex strategies, depend on each individual’s facts and circumstances. These strategies may involve material risks, costs, tax consequences, illiquidity, leverage, counterparty exposure, reduced flexibility, and other limitations. They may not be appropriate for all investors.
Any examples, hypotheticals, or references to potential strategies are provided solely for illustrative purposes and should not be interpreted as advice tailored to any individual investor. Actual results will vary. Assumptions, market conditions, tax laws, and individual circumstances may change, and such changes may materially affect the appropriateness or effectiveness of any strategy discussed. References to tax rates, exemption amounts, and statutory provisions reflect law in effect as of the date of preparation and are subject to change.
Third-party research and publications referenced herein are used with attribution for educational purposes; conclusions drawn are those of BakerStreet Advisors. Past performance is not indicative of future results. No investment strategy can guarantee a profit, avoid a loss, or achieve any particular outcome.
Baker Street does not provide legal or tax advice. Readers should consult their own tax, legal, accounting, estate planning, and other professional advisors before implementing any strategy or making any financial decision. Additional information about Baker Street, including its advisory services and fees, is available in its Form ADV, which is available upon request or through the SEC’s Investment Adviser Public Disclosure website.