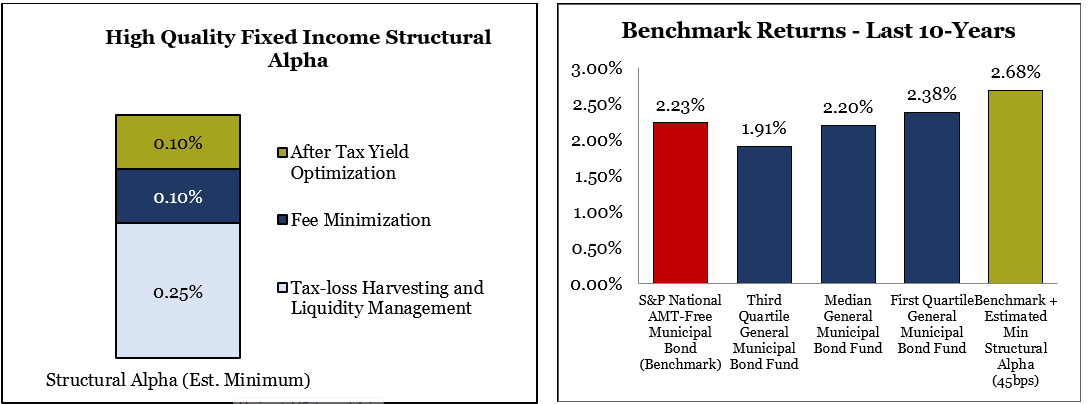
In this spotlight, we explore the key sources of structural alpha in high-quality fixed income markets: tax-loss harvesting, liquidity management, fee efficiency, and after-tax yield optimization. While each lever may appear modest in isolation, when thoughtfully integrated, they can collectively generate approximately 0.45% in annual structural alpha for taxable investors—more than double the 0.18% required to achieve top-quartile performance over the past decade. Notably, these benefits are achieved through process, not prediction—delivering results without relying on the uncertainty of manager-driven performance. According to S&P Global, over the past 10 years, the median national municipal bond fund delivered a 2.20% return, while top-quartile funds achieved 2.38%4.
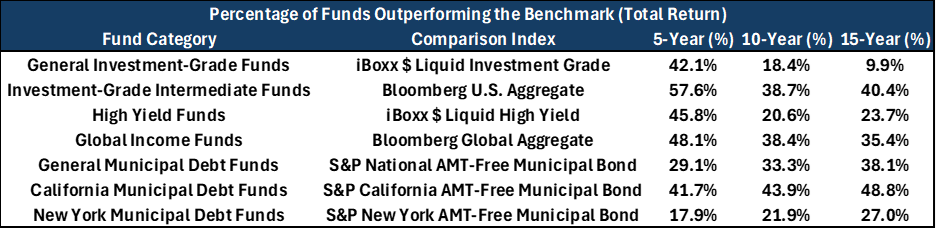
Challenged by high fees, trading costs, style drift, and increasingly efficient markets, most fixed income managers struggle to consistently add value. According to S&P Global, over 60% of intermediate-duration investment-grade bond funds underperformed the U.S. Aggregate Bond Index over the 10 years ending in 2024 -a trend mirrored in municipal bond strategies4. This analysis highlights a clear pattern: most managers fail to beat their benchmarks overtime. Rather than a critique of active management, the takeaway is constructive—investors seeking reliable, top-quartile, after-tax outcomes in their core public market strategies are better served by pursuing structural alpha.
At Baker Street Advisors, we emphasize structural alpha: a disciplined, evidence-based approach that leverages controllable processes to enhance long-term, after-tax returns in a consistent and repeatable manner. This philosophy guides both our portfolio construction and manager selection process. Recent technological advancements across the municipal bond market have improved our ability to access and implement structural alpha strategies. For more than two decades, this structure driven approach has delivered durable results, in contrast to the elusive and inconsistent performance of traditional strategies that prioritize market-beating returns without regard to tax efficiency.
Amid ongoing uncertainty around inflation and the direction of fiscal and monetary policy, interest rate volatility has risen significantly since the end of the zero-rate era—a defining feature of today’s fixed income markets. While this environment presents challenges, it also amplifies the value of tax-efficient strategies—particularly tax-loss harvesting—as a key lever for enhancing after-tax returns.
As inequities, heightened volatility creates outsized opportunities to realize tax alpha, though meaningful value can also be captured in more stable conditions. We believe systematic tax-loss harvesting in fixed income can reliably contribute 20 to 30 basis points in annual after-tax returns. This view is reinforced by research from Andrew Kalotay, published in the Financial Analysts Journal, which found that active tax management in high-quality fixed income portfolio scan add 30 to 100 basis points annually, depending on portfolio duration and investor-specific tax considerations.
Select municipal bond managers have developed specialized capabilities—especially around tax-loss harvesting and tax-loss crossing—that allow them to add consistent, tax-efficient value. Tax-loss crossing, an advanced form of harvesting, involves executing offsetting trades between separate investors. This technique is especially effective during periods when market pricing is transparent, but liquidity is limited, allowing managers to realize losses while staying invested- preserving portfolio characteristics such as duration, credit quality, and investment strategy.
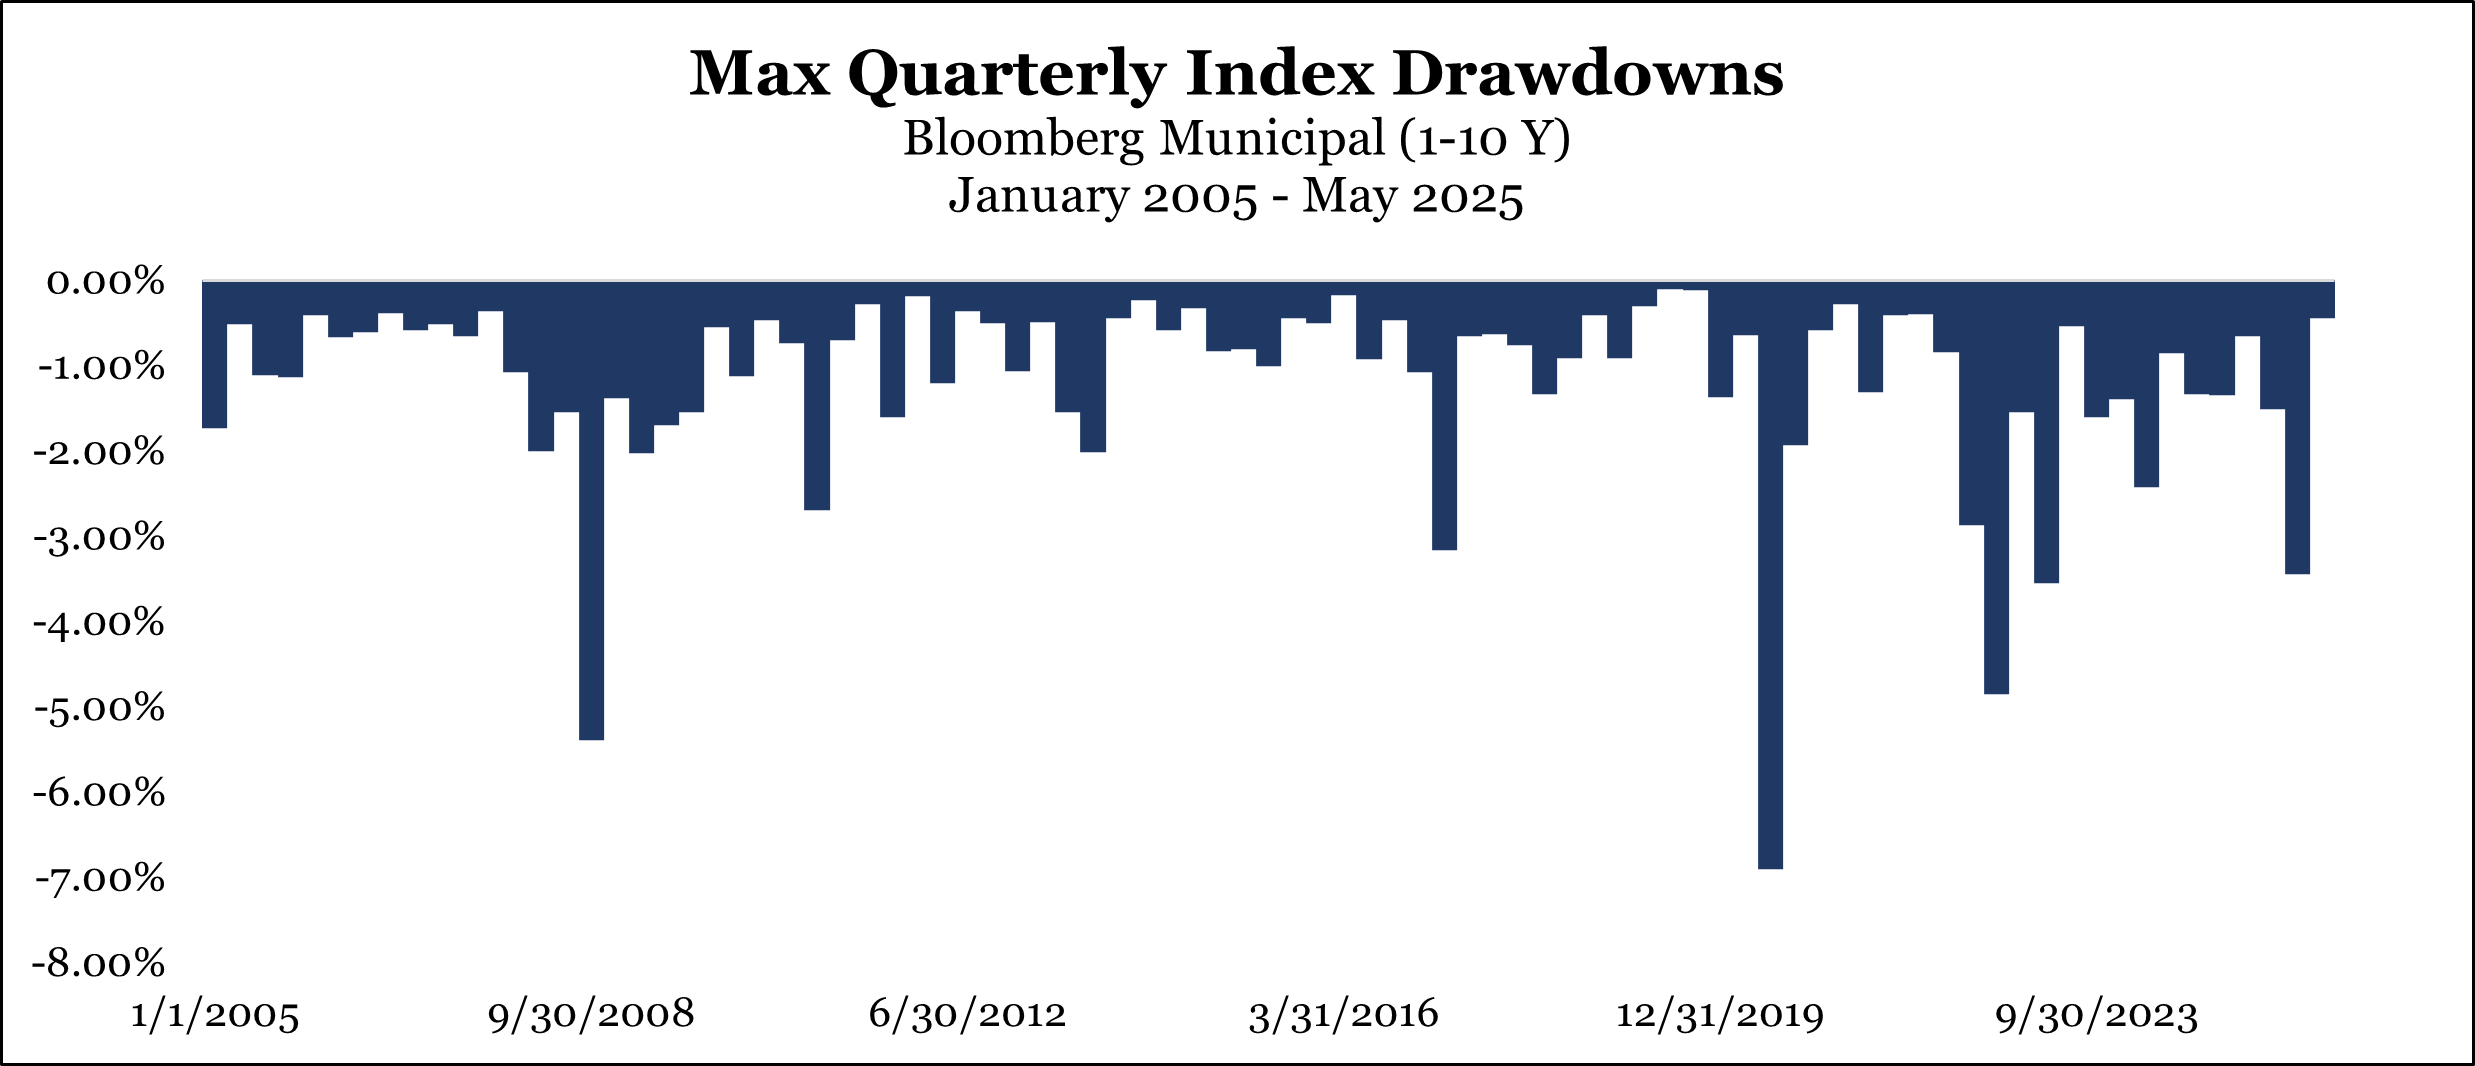
The chart below illustrates the daily drawdowns across rolling 90-day periods for the Bloomberg Municipal 1–10 Year Index over the past two decades, highlighting both the frequency and magnitude of opportunities for systematic tax-loss harvesting within high-quality municipal bond portfolios. Since January 2005, the index has experienced a median quarterly drawdown of 0.83% and an average drawdown of 1.19%, while still delivering an annualized return of 2.88% over the period.
What makes tax-loss harvesting in fixed income unique is that bonds have a finite lifecycle with stated maturity dates. As bonds mature and proceeds are reinvested, the cost basis of the portfolio is continually reset, creating recurring opportunities for realizing losses in a disciplined and systematic manner.
According to Morningstar’s 2024 Annual Fund Fees Study, the average asset-weighted fee for an actively managed municipal bond fund is 0.48%, compared to just 0.11% for passively managed municipal bond funds3. As noted above, we believe that by pursuing structural alpha, we can deliver top-quartile, active returns at below-average, passive fees.
At Baker Street, we harness the collective scale of our client base to negotiate highly competitive asset management fees. This scale allows us to secure institutional pricing for core-intermediate municipal bond strategies of less than 10bps. Relative to the average actively managed municipal bond fund, this represents savings of approximately 0.40% annually. Compared to the typical fees for high-quality separately managed accounts, this likely translates to around 0.10% + in annual fee advantage.
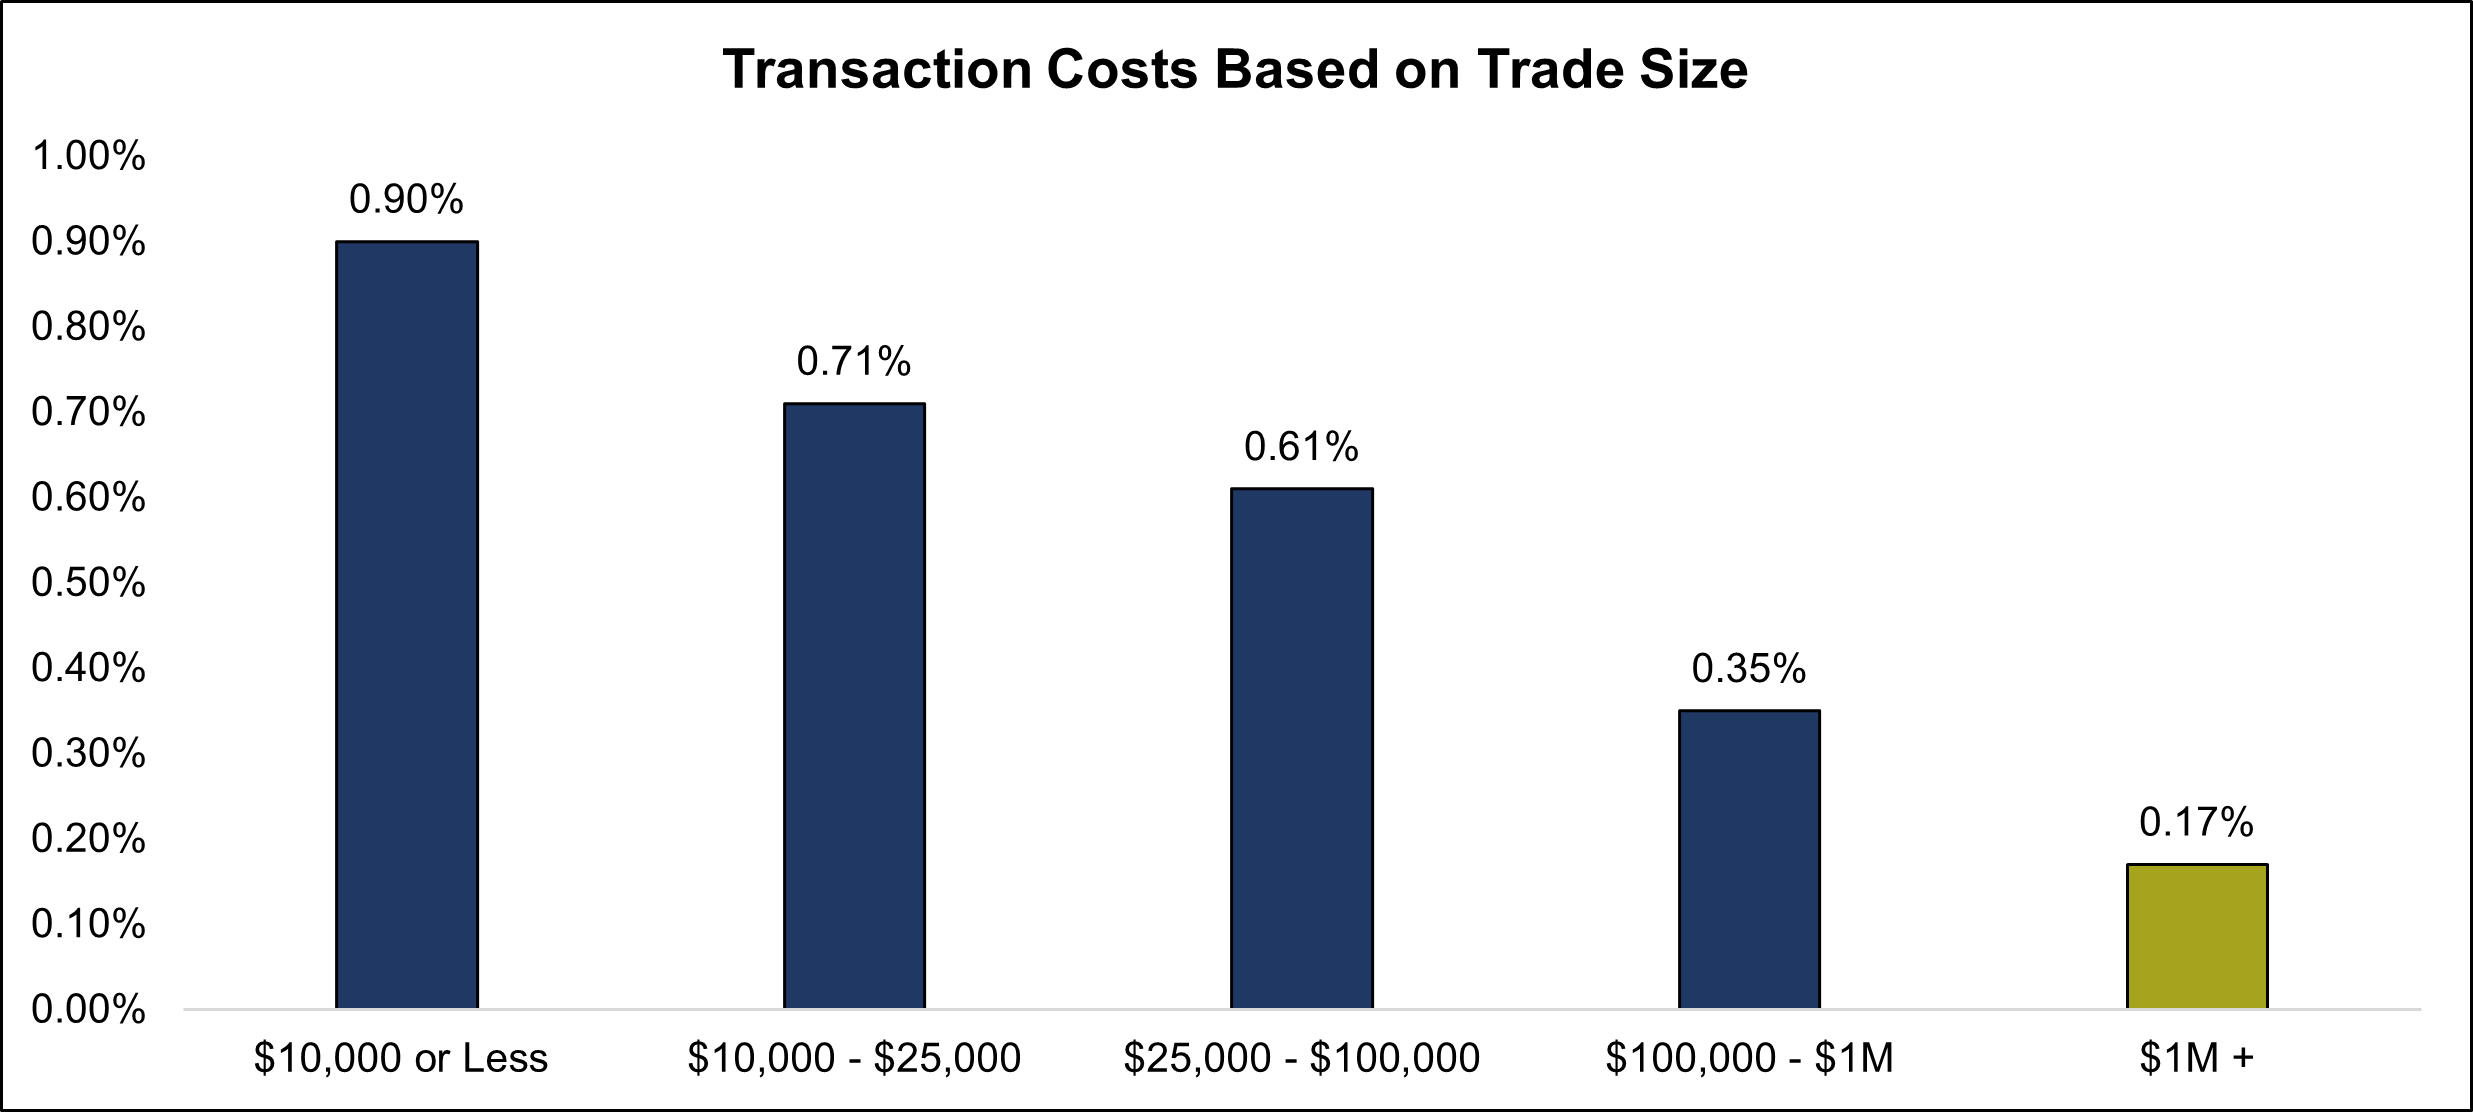
We believe that focusing solely on management fees overlooks a critical driver of net performance: total implementation costs. Research from S&P Global highlights the substantial value of efficient liquidity management and institutional-scale trade execution. A 2020 study revealed that retail investors paid an average implied transaction cost of 0.72% when buying individual investment-grade municipal bonds—more than four times the 0.17% incurred by institutional investors5. To put this in perspective, the average municipal bond trade size in 2024 was $229,086, according to the Municipal Securities Rulemaking Board1, underscoring the scale advantage available to institutional managers. Moreover, advanced capabilities such as tax-loss crossing not only enhance after-tax outcomes but also help reduce transaction costs—particularly during periods of heightened volatility—further reinforcing the benefits of thoughtful, cost-aware execution.
At its core, after-tax yield optimization means aligning the bonds that are right for an individual investor’s strategy and tax situation to maximize after-tax performance. While fund performance is typically discussed relative to pre-tax benchmarks, actual after-tax results are more difficult to assess due to variations in client-specific factors such as federal and state tax brackets, bond types, and state of domicile. As a result, this important dimension of portfolio construction is often underappreciated or not given sufficient attention. Key considerations include each investor’s tax profile, the details of state tax laws, fluctuations in yield across bond types over time, and the use of separately managed accounts to move beyond the limitations of pooled investment vehicles.
Careful optimization of allocations across each client’s unique tax profile is essential. Using a simple example to illustrate the point, the S&P National AMT-Free Municipal Bond Index allocates roughly 25% to New York bonds, 17% to California, and 10% to Texas, with the remainder spread across other states. This benchmark is constructed purely by outstanding bond issuance and does not account for the tax implications faced by high-net-worth investors. For instance, a California taxpayer in the highest marginal bracket pays no state tax on California municipal bond income but may incur up to a 13.3% state tax on income from out-of-state municipal bonds.
By systematically aligning bond allocations with each client’s state-specific tax exposure, after-tax yields can be meaningfully enhanced—while carefully managing portfolio risks such as duration, credit quality, liquidity, and strategic objectives.
To demonstrate, we compare the Bloomberg Municipal Bond – California Exempt (10Y) Index with both a duration-matched Bloomberg Municipal Bond – New York Exempt (10Y) Index and a duration matched Bloomberg Municipal Bond – Texas Exempt Index. While New York and Texas municipal bonds have often provided higher pre-tax yields (as they do today) over the past 20 years, their after-tax yields for California residents have consistently been lower due to the state’s taxation of out-of-state municipal income. That said, these markets are dynamic and the variation across different bond issuers in these states often make them attractive additions to a California taxpayer’s portfolio, and maintaining the flexibility to optimize portfolios based on after-tax yield considerations can add meaningful value.
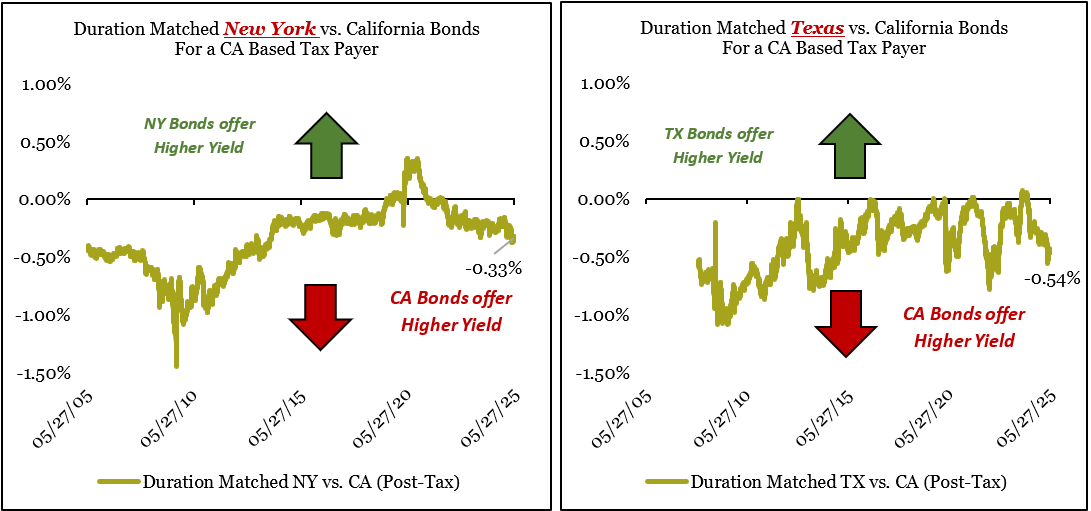
As of May 28, 2025, the reduction in after-tax income for a California resident holding out-of-state municipal bonds was significant—approximately 0.33% for New York bonds and 0.54% for Texas bonds. Given that national municipal indices typically allocate approximately 25% to New York and 10% to Texas, reallocating this exposure to California-specific bonds offers a compelling opportunity to improve after-tax returns. By aligning geographic exposures with the investor’s tax profile—while maintaining diversification and managing portfolio risk—we seek to maximize after-tax return per unit of risk in a consistent and disciplined manner. In fact, such a shift could boost portfolio-level after-tax yield by nearly 15 basis points. Our investment framework is designed to capitalize on these dynamics through flexible, tax-aware reallocations—including into U.S. Treasuries when they offer a superior after-tax, risk-adjusted return.
By focusing on structural alpha—through tax efficiency, cost control, and yield optimization—we seek to help clients capture the value others leave behind. In a world where traditional alpha is increasingly rare, these systematic advantages remain both accessible and enduring.