Q: Why should I own bonds in my portfolio?
At Baker Street, we believe high-quality fixed income plays a fundamental role in an investment portfolio, providing both stability and income across various market environments. Amid an aggressive rate-hiking cycle throughout 2022 & 2023—the steepest in over 50 years—bond investors have encountered a challenging environment, with Bank of America Global Research calling it "the greatest bond bear market of all time."
Despite some investors' surprise at recent bond performance, Baker Street believes the absolute returns are unsurprising given historically low starting yields. However, the relative underperformance of bonds compared to equities—which delivered above-average returns over the same period—has been more surprising. The performance difference was in large part due to the massive debt-fueled stimulus during the pandemic which boosted consumption (good for equities) at the expense of higher inflation (bad for bonds). The counterfactual—how markets would have behaved without massive COVID-19 fiscal stimulus—is unknowable. But since the future is uncertain and nearly impossible to predict, we focus on creating diversified and robust portfolios.
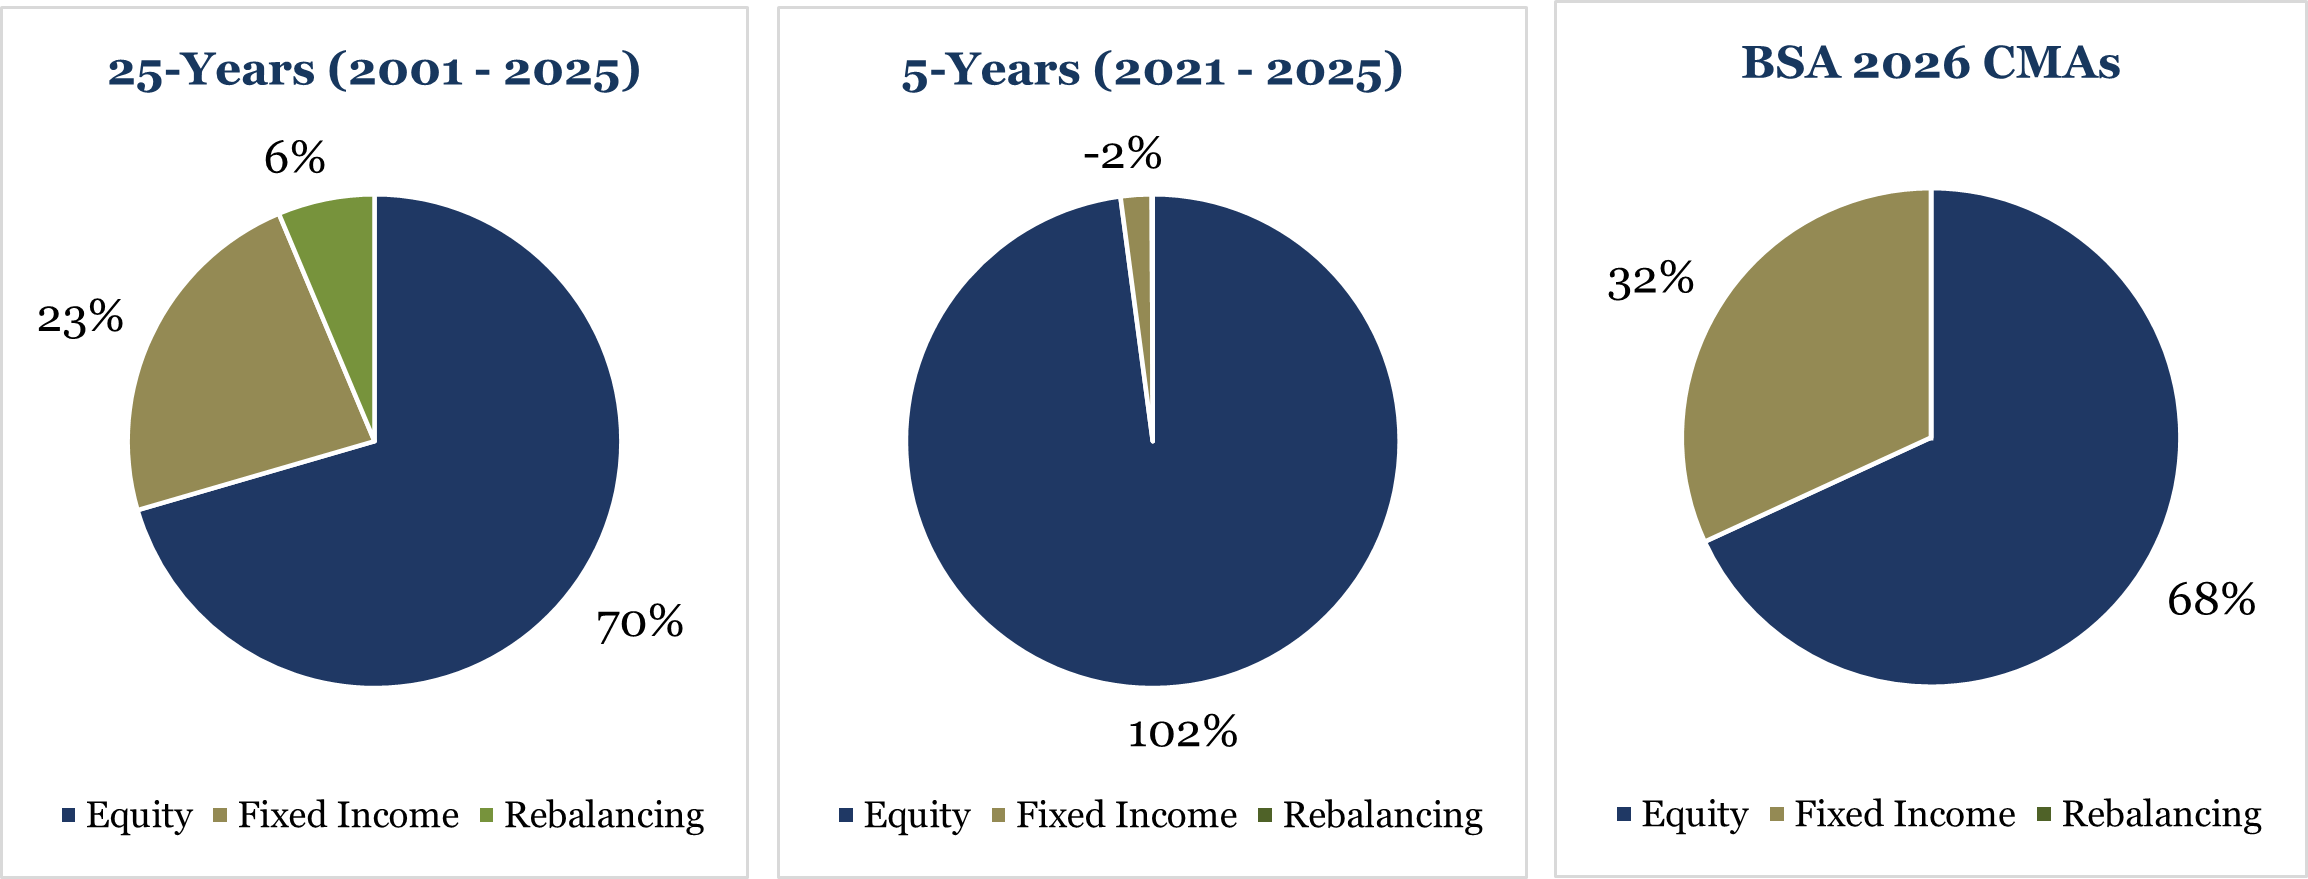
Over the 5-year period ending in 2024, a 60% Stock (MSCI ACWI) / 40% Bond (Bloomberg US Aggregate Index) portfolio, rebalanced quarterly, delivered an annual return of 6.9%, with equities driving all the gains. In fact, bonds detracted -0.3% per year from overall performance. However, over the 25-year period ending in 2024, the same 60/40 portfolio achieved an annual return of 6.1%, with stocks contributing 69% and bonds accounting for 25% of the total return (6% from rebalancing). Simply put, over the past five years, stocks have been the sole driver of returns in a 60/40 portfolio, whereas historically, the contribution has been more balanced.
Looking ahead, we at Baker Street project median annual equity returns of 7.1% over the next 10 years, while we expect the US Aggregate Bond Index to return 4.6%. In other words, we anticipate that the return contributions of a 60/40 portfolio in the coming decade will more closely resemble the last 25 years rather than the past 5-year period. Dismissing bonds due to their performance in recent years may underestimate the valuable role they can play in a long-term portfolio allocation, both in terms of potential future returns and risk reduction benefits.
In high-quality fixed-income—where historical and expected default rates are low—starting yields are the primary driver of future returns. If you buy a bond and hold it to maturity without any default, your return will be the initial yield. Bond portfolios and indices, while involving multiple maturities and rolling reinvestments, generally follow a similar formula: Return ≈ yield - default losses.
While forecasting the future is challenging, the path is clearer with bonds. Bond yields reflect a promise of future payments, offering greater certainty about what lies ahead. There’s more to it, of course, but starting yield is the foundation. The true uncertainties arise from factors like inflation, issuance, the Fed, the economy, and government policy. Yet, the yield—reflecting the market’s future expectations—remains a strong starting point.
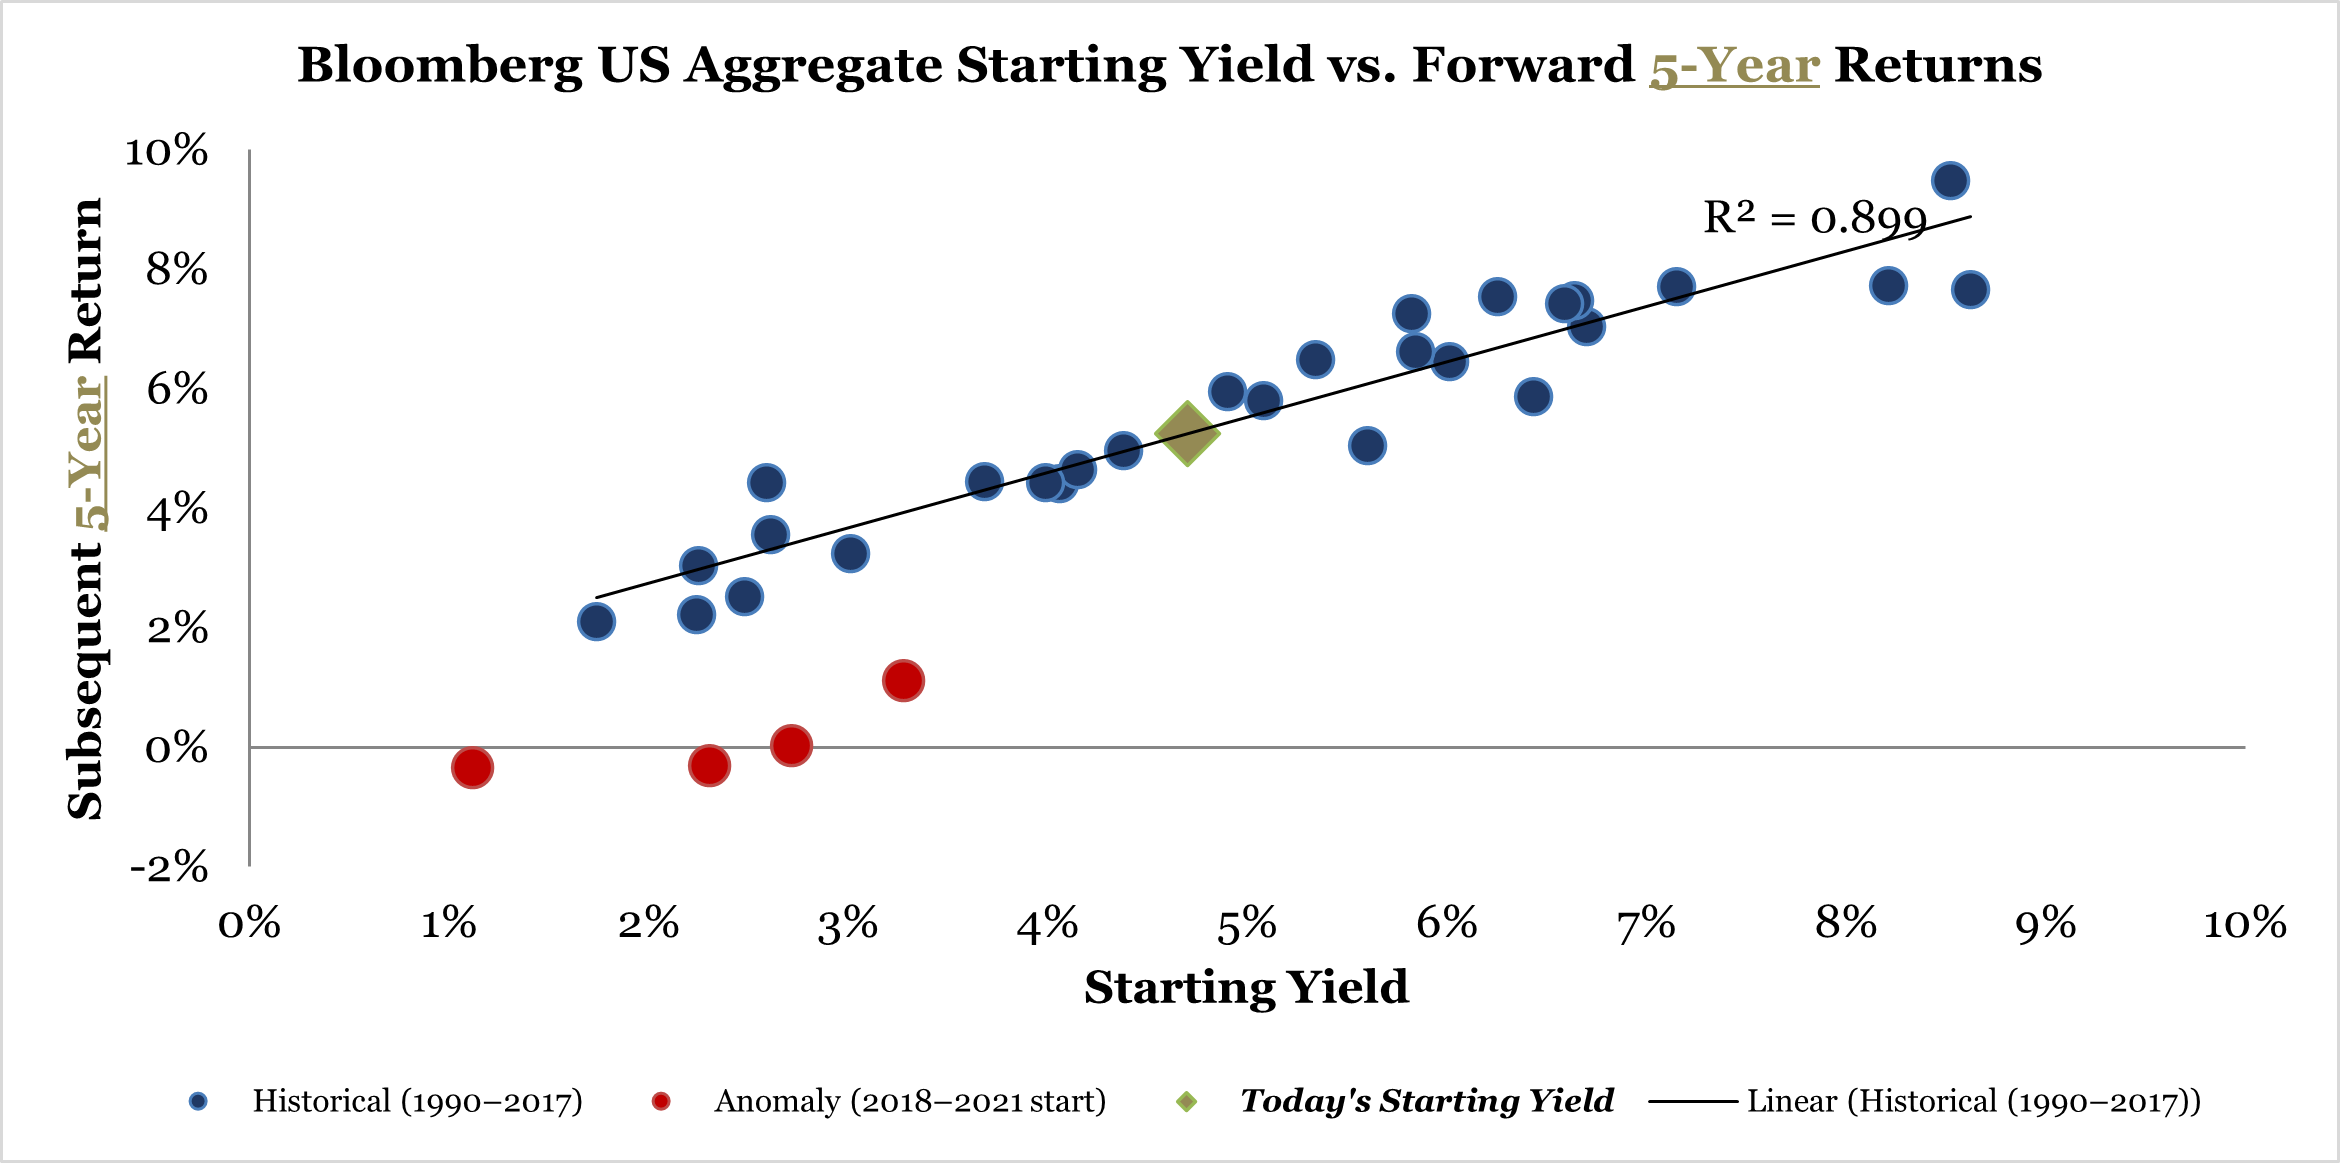
To better understand this, we can analyze the historical relationship between the starting yield of the Bloomberg US Aggregate Index—a benchmark for high-quality investment-grade bonds—and its subsequent returns. As illustrated in the chart below, since 1990, the starting yield has exhibited a 90% correlation with 5-year total returns. In other words, the yield at the time of investment has, on average, accounted for 81% of the index’s performance over the following five years (R² = Correlation²). This relationship becomes even stronger if we look at longer 10-year periods, with starting yields explaining 88% of subsequent 10-year returns since 1990. Moreover, the 5-year investment periods starting in 2018, 2019, and 2020 (ending in 2022, 2023, and 2024, respectively) are relatively anomalous compared to the past 35 years.
After a period of exceptional equity market performance and underwhelming bond returns, it’s understandable to question the value of holding bonds. However – as we’ve noted – we believe bonds play a fundamental role in providing diversification, stability, and income for long-term investors. At Baker Street, we focus on building portfolios that can weather various economic and market conditions, not just those shaped by a strong stock market. Although recent years have been challenging for fixed income investors, the outlook is more promising, as yields on high-quality bonds have reached their highest levels in over 20 years. With starting yields being a key driver of future returns, we see a compelling opportunity for bonds to continue serving as a cornerstone of a well-constructed portfolio.


