

Search the site

Recently, Meta founder Mark Zuckerberg remarked that his company might be “misspending a couple of hundred billion dollars,” but when it comes to AI, the risk of underinvesting far outweighs the risk of overinvesting. Around the same time, Oracle announced a data-infrastructure partnership with OpenAI that sent its stock up 36% in a single session- one of the three largest moves ever for a company of its size.
Episodes like this are a reminder for investors to exercise caution. As Warren Buffet famously advised: “Be fearful when others are greedy, and greedy when others are fearful.”
We are closely evaluating two developments shaping markets today:
Market history is filled with boom-and-bust cycles driven by investors seeking outsized returns. Some investors may feel tempted to overweight AI themes in advance of future gains, while others may seek to reduce exposure in anticipation of a correction. Our perspective, built on long observation, is that major portfolio changes based on predictions usually do more harm than good.
As Peter Lynch, the famed Fidelity Magellan Fund manager once noted, “Far more money has been lost by investors preparing for corrections, or trying to anticipate corrections, than has been lost in the corrections themselves.”
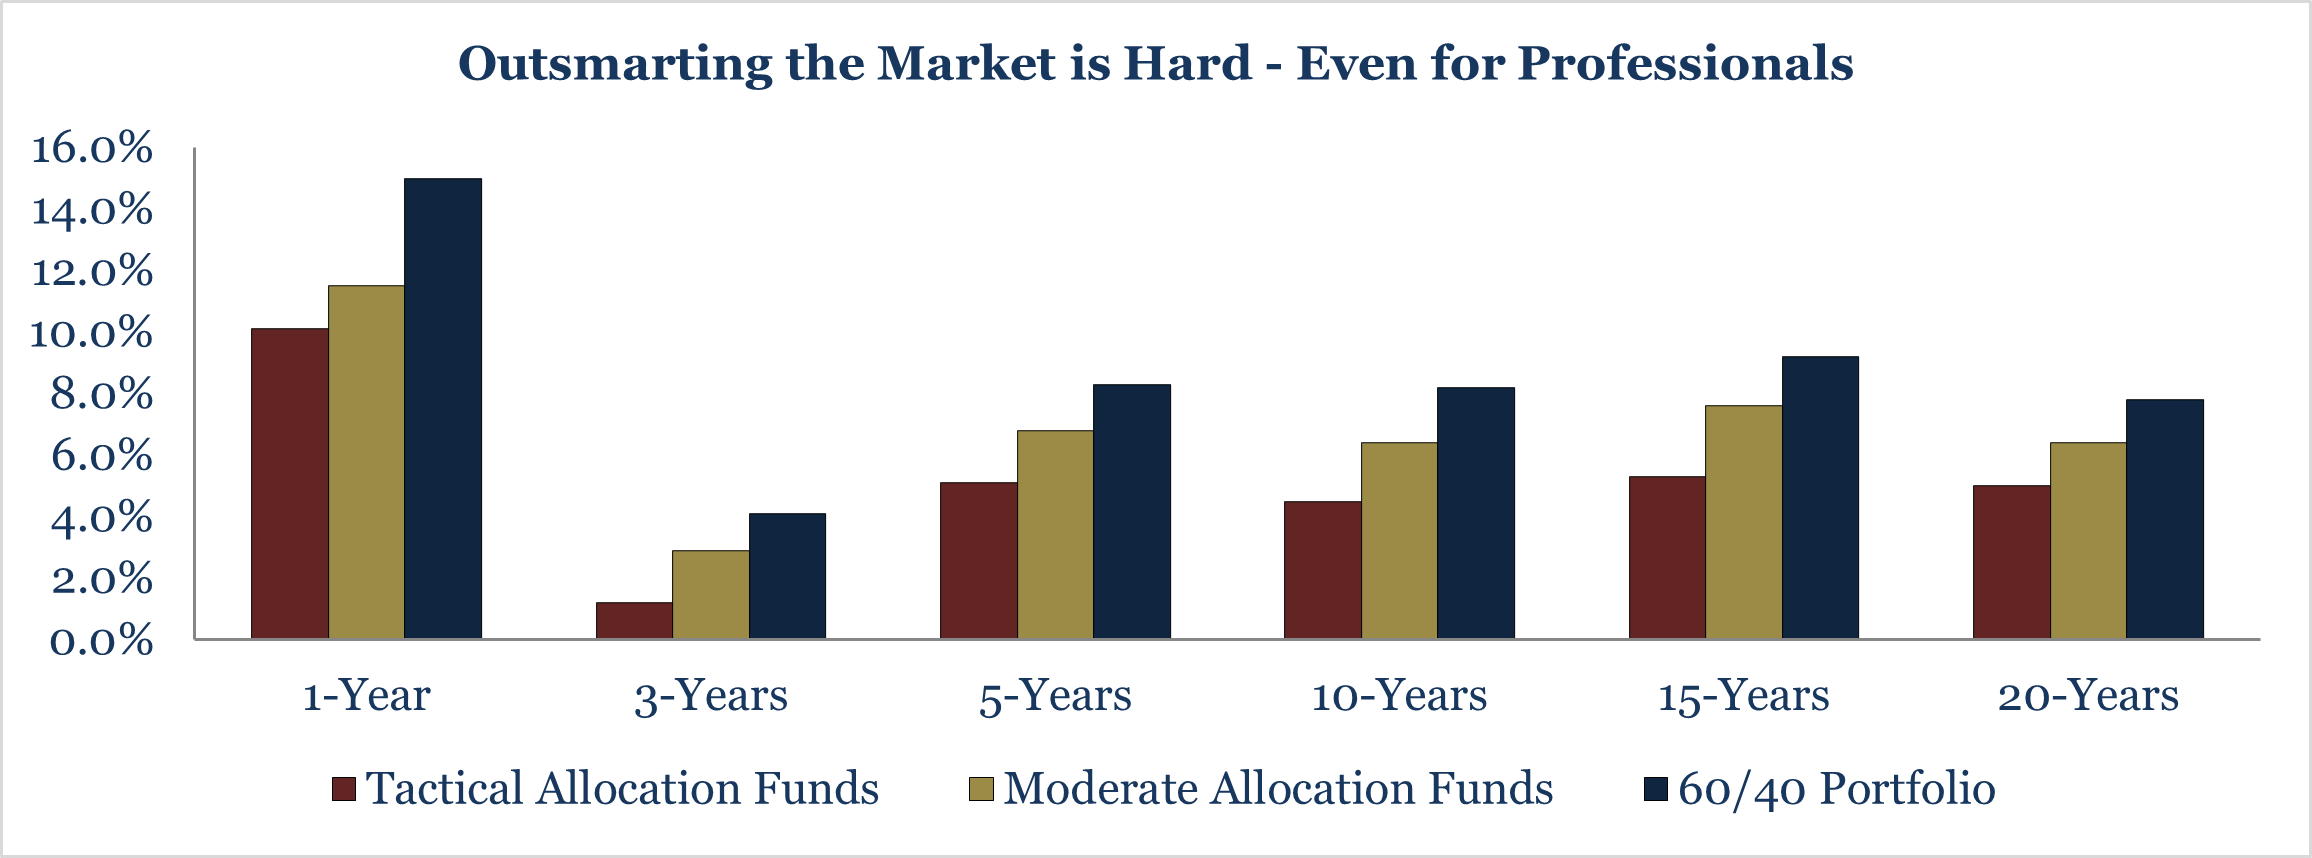
Research supports this view: funds designed to tactically shift exposures have historically underperformed a simple 60/40 benchmark. Even professionals are poor at predicting future returns. After accounting for taxes, performance looks even worse.
The two largest asset classes in most portfolios are stocks and bonds. Reviewing these through the lens of AI exposure can provide important insight into portfolio risks.
At the simplest level, there are two key questions to ask:
While the fate of AI will impact most sectors (infrastructure, banks, utilities), the surge in enthusiasm around artificial intelligence has propelled a handful of mega-cap technology companies to outsized prominence in most portfolios. Nearly all this year’s increase to S&P 500 earnings forecasts have come from just seven AI related names.2
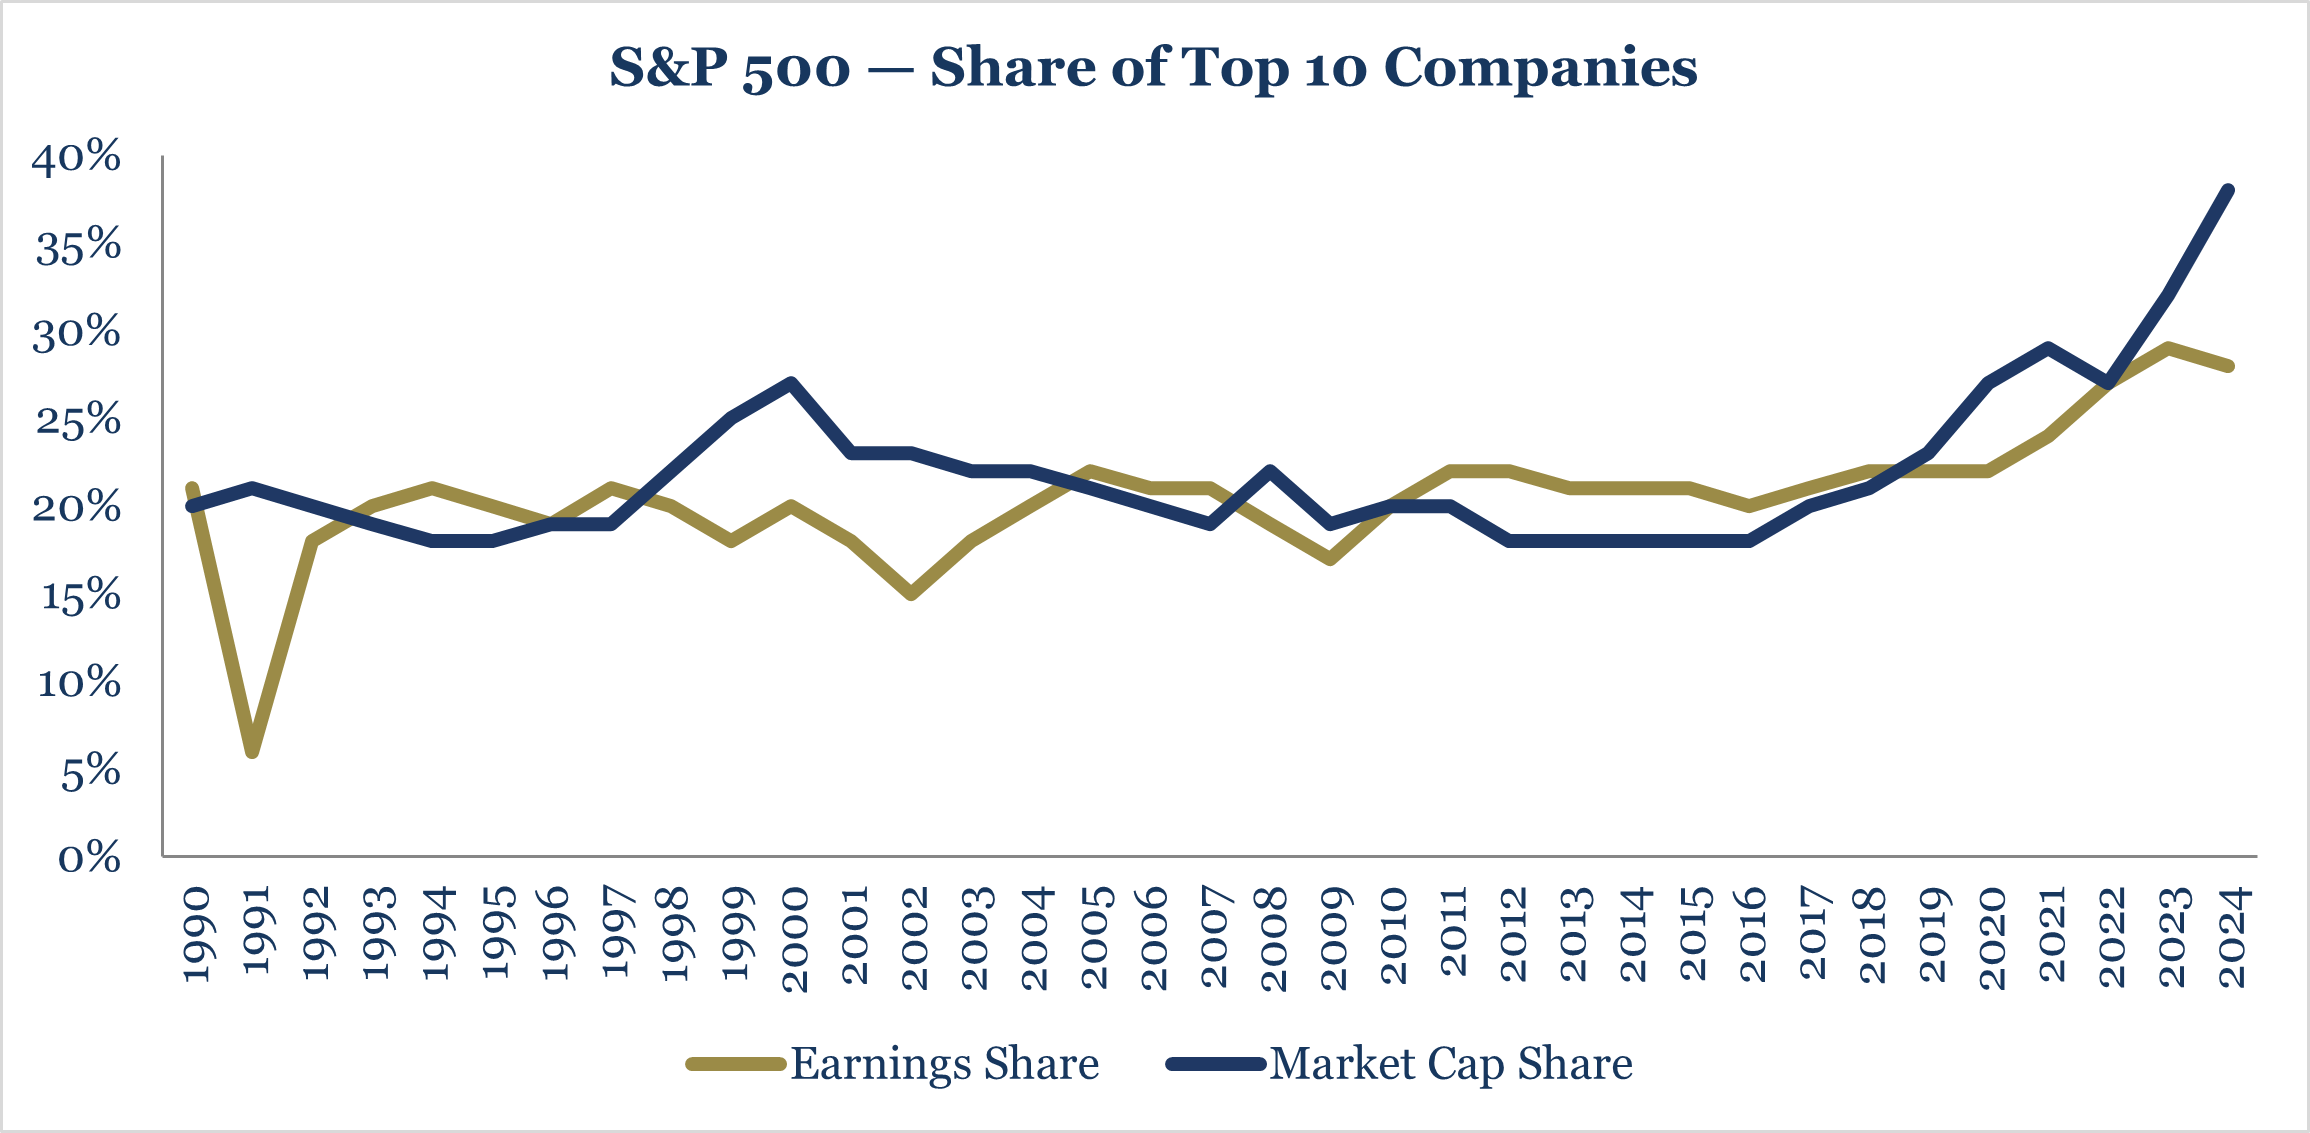
This has increased the concentration of the top 10 stocks in the S&P 500 to around 40%, the highest in decades. By comparison, the top 10 stocks in the MSCI ACWI, a global equity index, represent closer to 25%. While global equity investors are not immune from the increasing AI exposure, they have more diversification in the event of a pullback.

With strong recent performance, many tax-efficient direct indexing portfolios designed to maximize long-term compounding now have higher weightings to many of the top names. Any outright sale of these stocks would likely trigger a significant taxable event.
While capital gains may need to be realized periodically as part of regular rebalancing to maintain portfolio diversification, we generally discourage it as a proactive strategy as the tax cost impedes compounding. However, charitable gifting (including donor-advised funds) and tax-loss harvesting may reduce the tax cost. For example, losses realized in other parts of the portfolio can be used to tax-efficiently diversify an equity separate account, helping to reduce tracking error against the benchmark and lessen concentrated exposure to AI-related names. Your advisor can help evaluate these strategies.
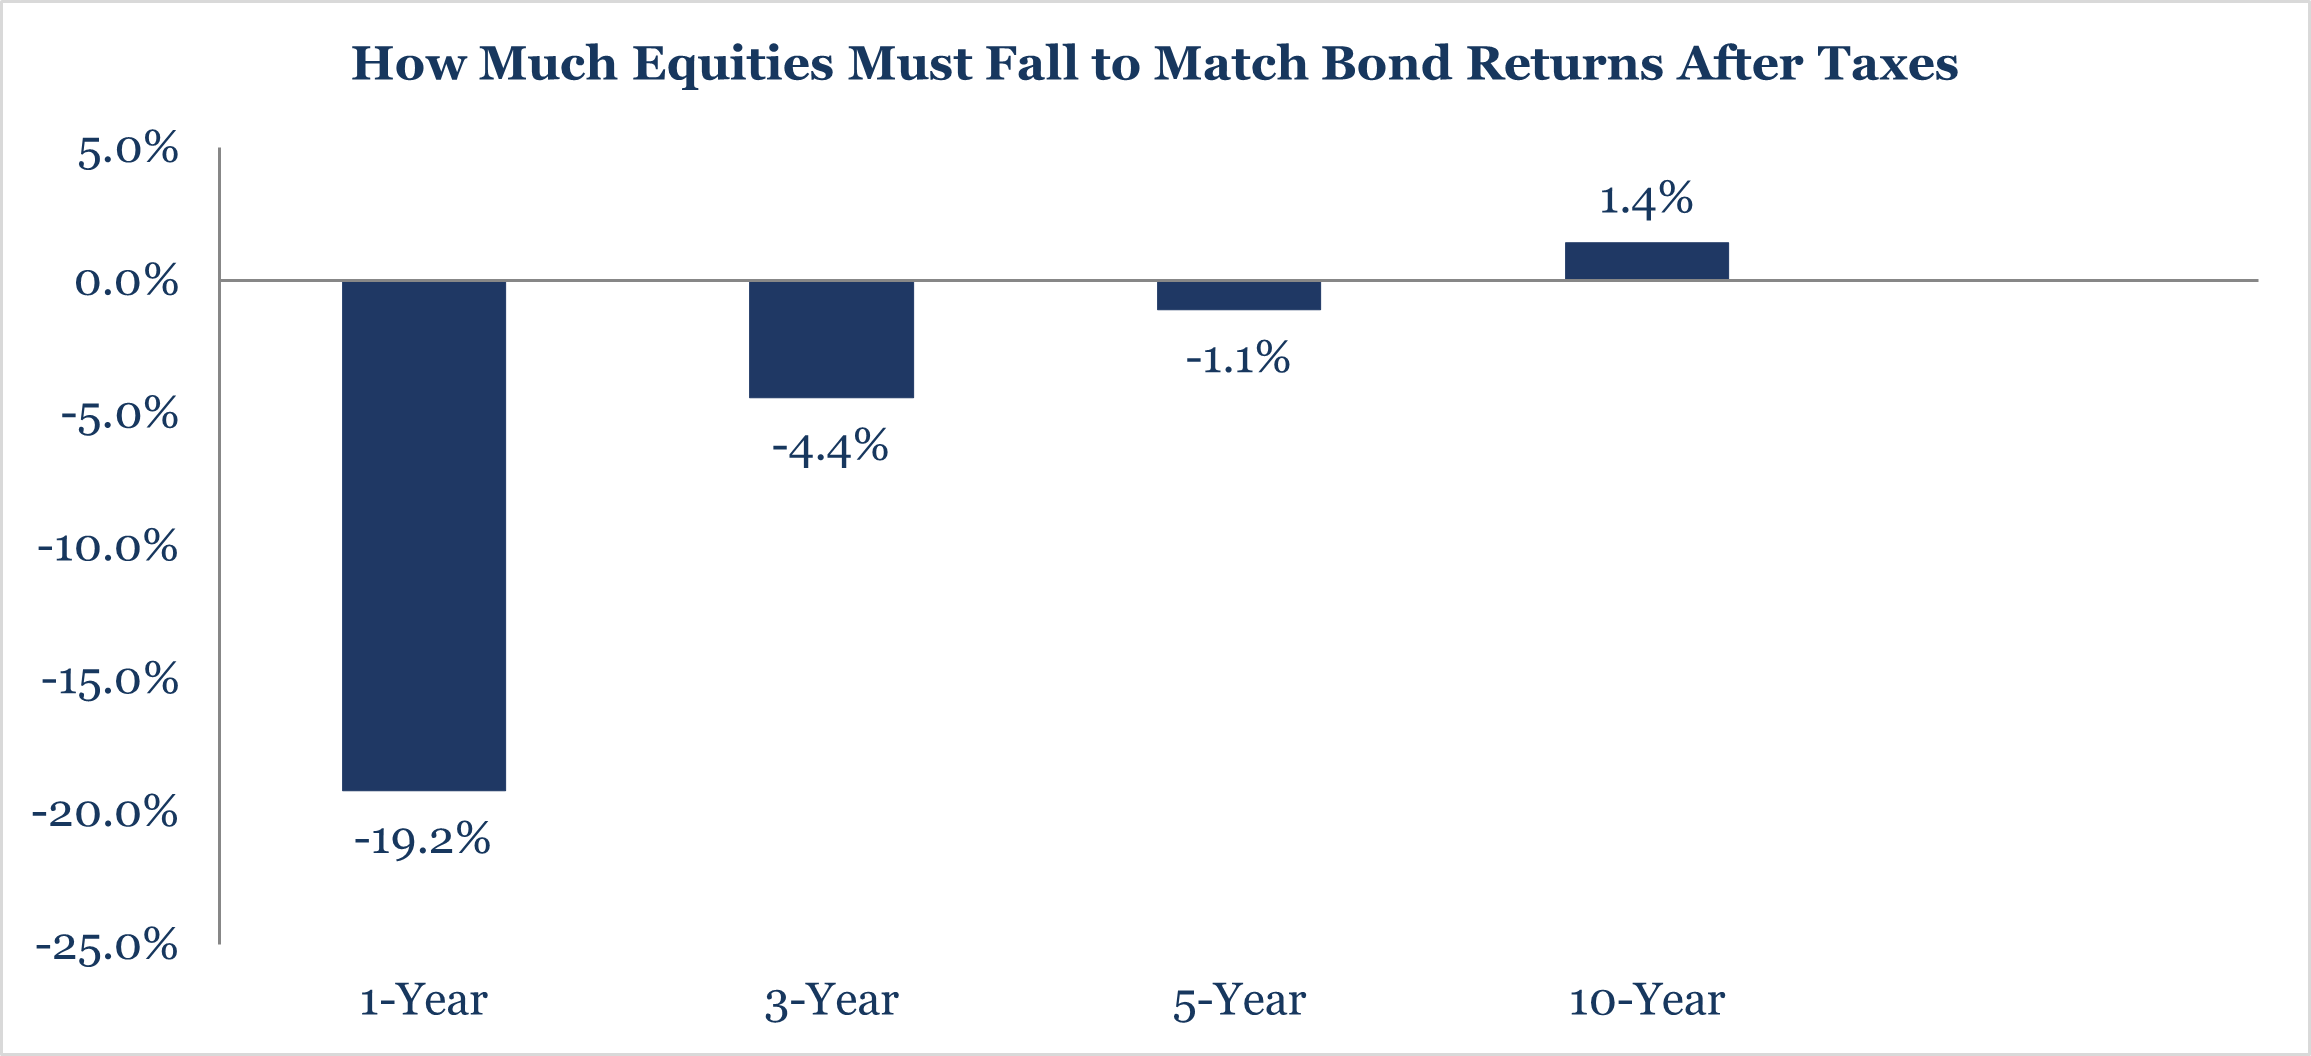
Most investors should take no action through their public equity exposure and instead adhere to disciplined portfolio management processes such as regular rebalancing back to the target allocation and tax loss harvesting. The upfront tax cost of liquidating low-basis stock is significant, and the value of reducing equity exposure is unpredictable. For an investor whose stock portfolio has a cost basis equal to 40% of the current market value (most investing for 8+ years), selling now would trigger significant capital gains taxes and hinder future compounding.
Over a 10-year period, the equity position would only need to earn about 1.4% per year to match the return of bonds yielding 4%, given the lower after-tax proceeds if the position were sold today. In other words, even modest equity returns could outperform bonds once the immediate tax cost of selling is considered. Stocks would have to fall roughly 20% in the next year for selling today to break even with holding. While it’s possible to benefit from such a decline by selling and buying back later, successfully timing both moves is extremely difficult — both tactically and emotionally.
For most taxable investors, high-quality municipal bonds form the foundation of their fixed income exposure. Unlike equities, bonds have defined outcomes: the return of principal plus regular interest payments. Because these securities are typically held to maturity, the primary risk to manage is default risk. The managers we work with emphasize conservative underwriting, prioritizing the return of capital rather than a return on capital.
Municipal bonds remain largely insulated from AI-related risks. The largest sectors — education, healthcare, housing, and transportation — are driven by local tax bases and user charges, while public power index exposure is modest (low single digits). That said, AI-driven data center growth is expected to raise U.S. electricity demand significantly — from about 4% of total consumption today to 8% by 2030. Public utilities, which account for roughly 15% of total U.S. electricity use, have increased bond issuance in recent years to fund this capacity expansion.3
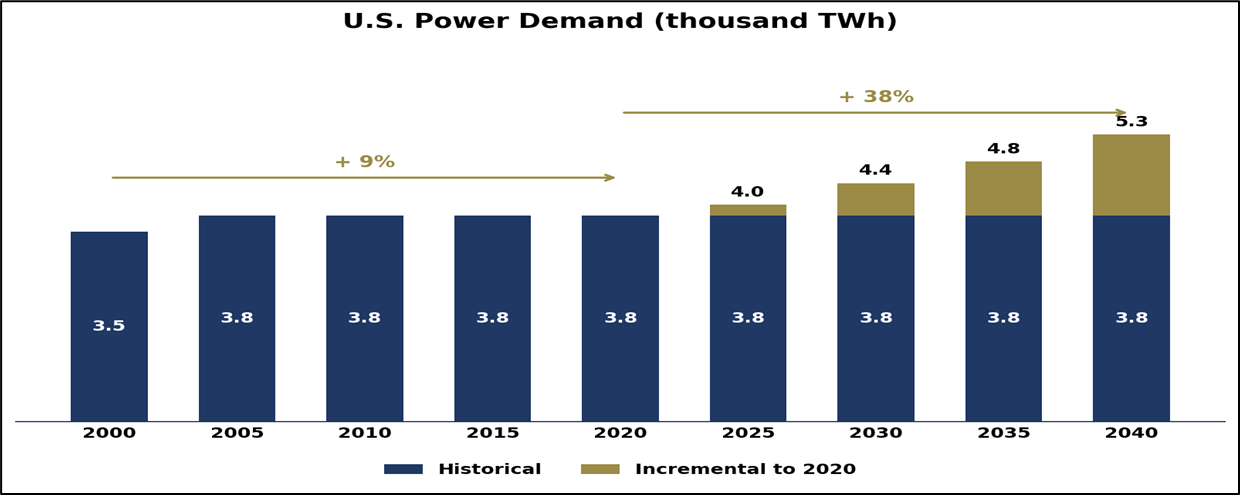
While utilities have been able to pass costs on to consumers to date, evolving regulations may limit this in the future, reinforcing the importance of credit selection. Overall, municipal credit fundamentals are strong, with healthy rainy-day balances and low debt-to-GDP ratios providing reassurance that municipal bonds should be able to withstand an AI-related downturn.4
Private markets now play a central role in both AI-related opportunities and broader capital markets activity. Private credit, particularly direct lending, has grown rapidly—rising from under $500 billion a decade ago to nearly $2.3 trillion by mid-2024.5
A common misconception is that allocating across private asset classes improves diversification. Data centers and AI infrastructure, while categorized as real estate, are closely tied to the same trends driving public markets. Logistics, multifamily, or healthcare real estate may be less directly correlated but likely still have indirect exposure. It should come as no surprise that the Bay Area has the highest expected apartment rental growth over the next five years while simultaneously having the highest share of AI startups. Venture Capital funds are more correlated to the public tech stocks dominating many portfolios.
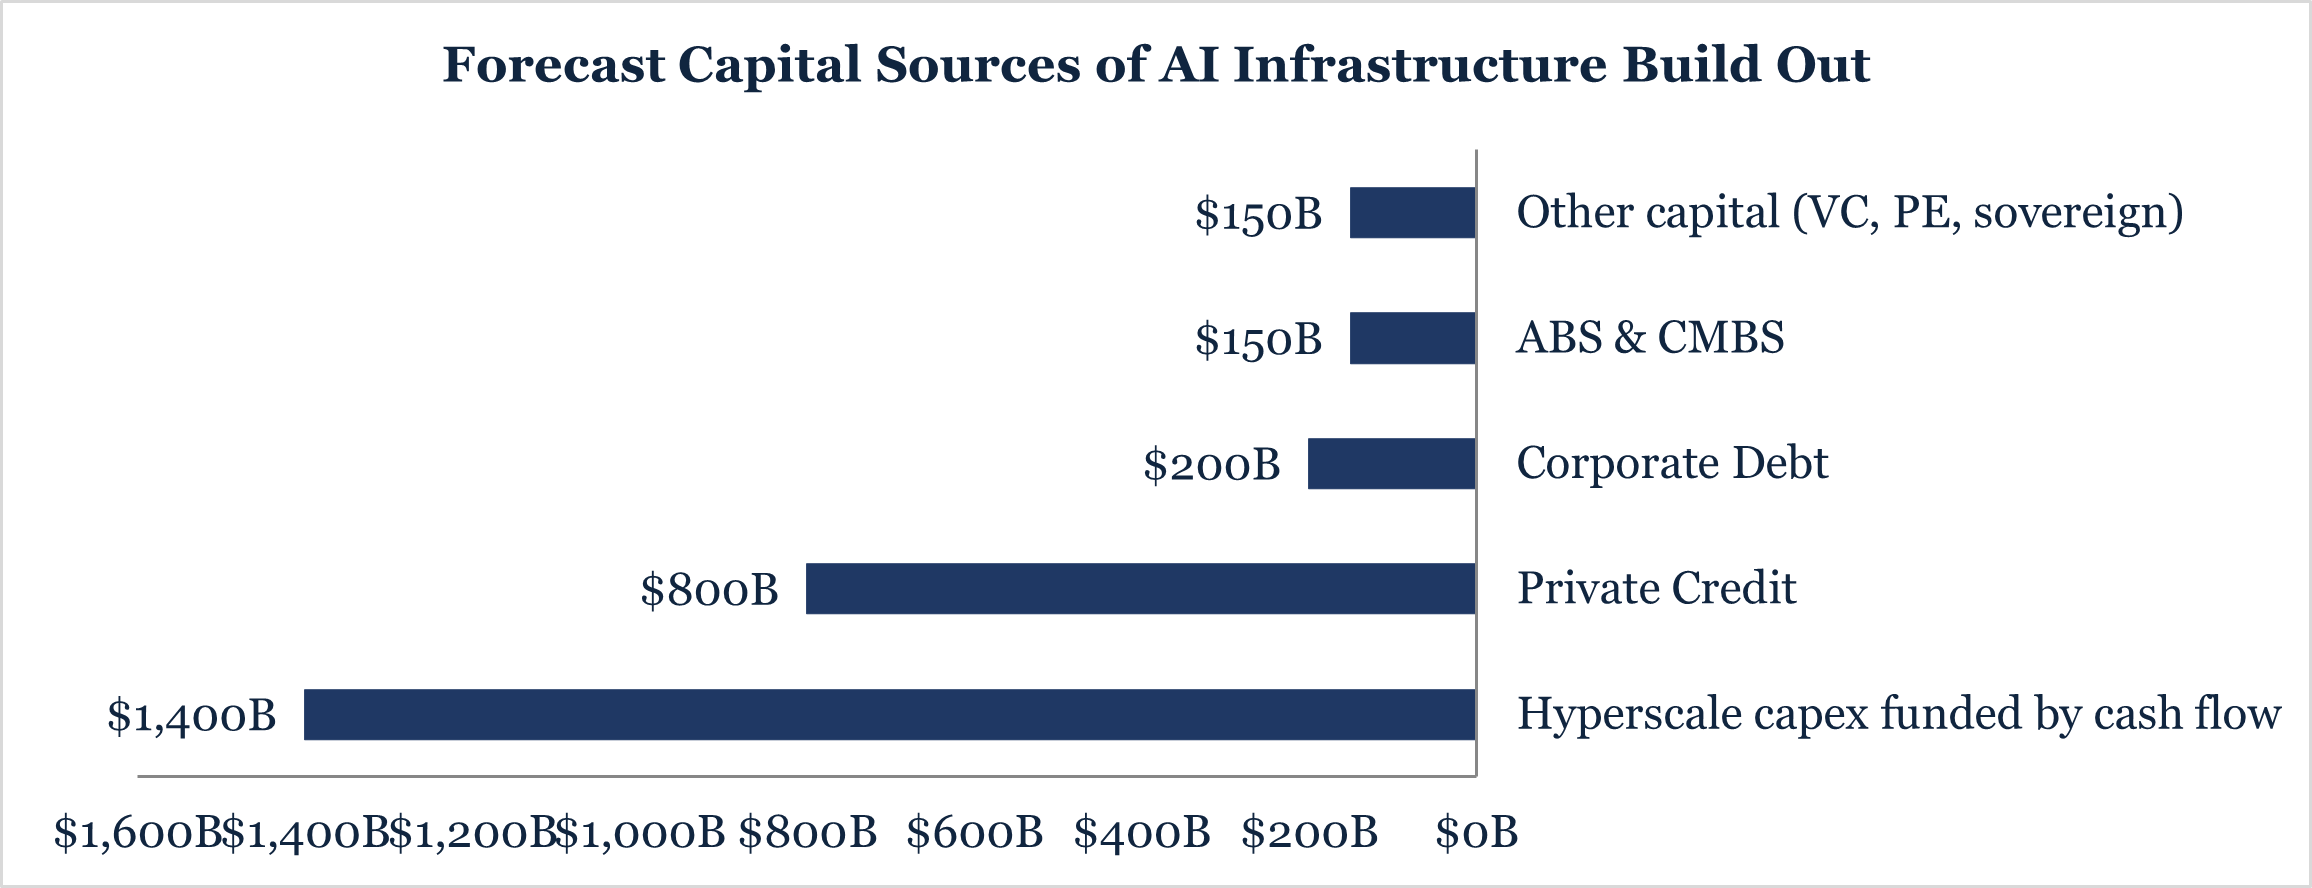
Investors cannot fully eliminate these risks, but they can reduce undue exposure through thoughtful private portfolio construction. For investors with exposure to private investments, Baker Street recommends focusing on the below:
The top-performing funds in recent periods are often those most aligned with the prevailing market narrative—sometimes at the expense of diversification. We approach private markets with greater selectivity and discipline, seeking managers who prioritize long-term durability over short-term momentum. By focusing on strategy-level diversification and risk awareness, we aim to help client portfolios capture private market opportunities while minimizing correlation risk.
The current pattern is not without precedent. Surges of capital into promising technologies have occurred before—from the railway mania in the 1800s to the dot-com boom of the late 1990s.7 History shows that investor psychology often follows a familiar arc during periods of rapid innovation: early optimism accelerates into euphoria, risks are overlooked, and “this time is different” takes hold. Eventually, expectations outpace reality, leading to sharp corrections when sentiment shifts.
Looking ahead, our focus is not on predicting the next swing in sentiment, but on preparing portfolios to withstand a wide range of outcomes. AI is one of the defining investment themes of this era—worthy of attention for its opportunities but equally deserving of respect for its risks. Our role is to help clients participate thoughtfully, with active monitoring, disciplined allocation, and diversification that guard against overconcentration.


